Report Summary

  • 76

    Performance

    Renders faster than
    84% of other websites

  • 97

    Accessibility

    Visual factors better than
    that of 92% of websites

  • 92

    Best Practices

    More advanced features
    available than in
    81% of websites

  • 83

    SEO

    Google-friendlier than
    46% of websites

atilika.com

AI + Language | Atilika

Page Load Speed

901 ms in total

First Response

372 ms

Resources Loaded

529 ms

Page Rendered

0 ms
atilika.com screenshot

About Website

Visit atilika.com now to see the best up-to-date Atilika content for Japan and also check out these interesting facts you probably never knew about atilika.com

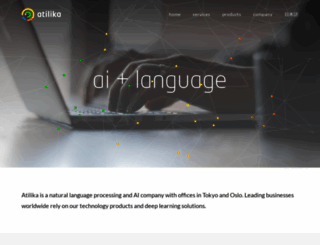
Atilika is a natural language processing and AI company with offices in Tokyo and Oslo. Leading businesses worldwide rely on our technology products and deep learning solutions.

Visit atilika.com

Key Findings

We analyzed Atilika.com page load time and found that the first response time was 372 ms and then it took 529 ms to load all DOM resources and completely render a web page. This is an excellent result, as only 5% of websites can load faster.

Performance Metrics

atilika.com performance score

76

Measured Metrics

name

value

score

weighting

FCP (First Contentful Paint)

Value3.4 s

38/100

10%

LCP (Largest Contentful Paint)

Value3.8 s

55/100

25%

SI (Speed Index)

Value3.4 s

89/100

10%

TBT (Total Blocking Time)

Value100 ms

98/100

30%

CLS (Cumulative Layout Shift)

Value0.011

100/100

15%

TTI (Time to Interactive)

Value7.5 s

48/100

10%

Network Requests Diagram

atilika.com

372 ms

17fb66da.atilika.js

151 ms

Our browser made a total of 2 requests to load all elements on the main page. We found that all of those requests were addressed to Atilika.com and no external sources were called. The less responsive or slowest element that took the longest time to load (372 ms) belongs to the original domain Atilika.com.

Page Optimization Overview & Recommendations

Page size can be reduced by 1.2 kB (52%)

Content Size

2.4 kB

After Optimization

1.1 kB

In fact, the total size of Atilika.com main page is 2.4 kB. This result falls within the top 5000 of lightweight and thus fast loading web pages. Only a small number of websites need less resources to load. Javascripts take 2.1 kB which makes up the majority of the site volume.

HTML Optimization

-32%

Potential reduce by 102 B

  • Original 319 B
  • After minification 303 B
  • After compression 217 B

HTML content can be minified and compressed by a website’s server. The most efficient way is to compress content using GZIP which reduces data amount travelling through the network between server and browser. HTML code on this page is well minified. It is highly recommended that content of this web page should be compressed using GZIP, as it can save up to 102 B or 32% of the original size.

JavaScript Optimization

-55%

Potential reduce by 1.1 kB

  • Original 2.1 kB
  • After minification 2.1 kB
  • After compression 925 B

It’s better to minify JavaScript in order to improve website performance. The diagram shows the current total size of all JavaScript files against the prospective JavaScript size after its minification and compression. It is highly recommended that all JavaScript files should be compressed and minified as it can save up to 1.1 kB or 55% of the original size.

Requests Breakdown

We found no issues to fix!

Requests Now

1

After Optimization

1

The browser has sent 1 CSS, Javascripts, AJAX and image requests in order to completely render the main page of Atilika. According to our analytics all requests are already optimized.

Accessibility Review

atilika.com accessibility score

97

Accessibility Issues

Contrast

These are opportunities to improve the legibility of your content.

Impact

Issue

High

Background and foreground colors do not have a sufficient contrast ratio.

Best Practices

atilika.com best practices score

92

Areas of Improvement

Trust and Safety

Impact

Issue

High

Does not use HTTPS

Low

Ensure CSP is effective against XSS attacks

General

Impact

Issue

Low

Detected JavaScript libraries

High

Page has valid source maps

SEO Factors

atilika.com SEO score

83

Search Engine Optimization Advices

Content Best Practices

Format your HTML in a way that enables crawlers to better understand your app’s content.

Impact

Issue

High

Links do not have descriptive text

Crawling and Indexing

To appear in search results, crawlers need access to your app.

Impact

Issue

High

Links are not crawlable

Mobile Friendly

Make sure your pages are mobile friendly so users don’t have to pinch or zoom in order to read the content pages. [Learn more](https://developers.google.com/search/mobile-sites/).

Impact

Issue

High

Document uses legible font sizes

High

Tap targets are not sized appropriately

Language and Encoding

  • Language Detected

    EN

  • Language Claimed

    N/A

  • Encoding

    UTF-8

Language claimed in HTML meta tag should match the language actually used on the web page. Otherwise Atilika.com can be misinterpreted by Google and other search engines. Our service has detected that English is used on the page, and neither this language nor any other was claimed in <html> or <meta> tags. Our system also found out that Atilika.com main page’s claimed encoding is utf-8. Use of this encoding format is the best practice as the main page visitors from all over the world won’t have any issues with symbol transcription.

Social Sharing Optimization

Open Graph description is not detected on the main page of Atilika. Lack of Open Graph description can be counter-productive for their social media presence, as such a description allows converting a website homepage (or other pages) into good-looking, rich and well-structured posts, when it is being shared on Facebook and other social media. For example, adding the following code snippet into HTML <head> tag will help to represent this web page correctly in social networks: