Report Summary

  • 43

    Performance

    Renders faster than
    62% of other websites

  • 83

    Accessibility

    Visual factors better than
    that of 56% of websites

  • 83

    Best Practices

    More advanced features
    available than in
    56% of websites

  • 77

    SEO

    Google-friendlier than
    36% of websites

pinolero.com

Pinolero.com

Page Load Speed

3.6 sec in total

First Response

505 ms

Resources Loaded

2.4 sec

Page Rendered

654 ms
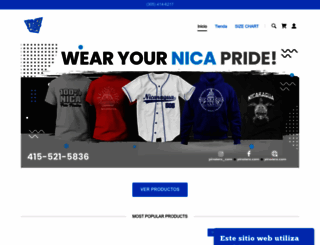
pinolero.com screenshot

About Website

Click here to check amazing Pinolero content. Otherwise, check out these important facts you probably never knew about pinolero.com

Envio a todo USA ORDENA AHORA 415.525.6006 jerseys,pinolillo,cacao,rosquillas,camisetas de beisbol,productos Nicas,los angeles,san francisco,camisas personalizadas,nicaraguan products in the us, nica...

Visit pinolero.com

Key Findings

We analyzed Pinolero.com page load time and found that the first response time was 505 ms and then it took 3.1 sec to load all DOM resources and completely render a web page. This is a poor result, as 55% of websites can load faster.

Performance Metrics

pinolero.com performance score

43

Measured Metrics

name

value

score

weighting

FCP (First Contentful Paint)

Value2.1 s

81/100

10%

LCP (Largest Contentful Paint)

Value7.3 s

4/100

25%

SI (Speed Index)

Value4.1 s

78/100

10%

TBT (Total Blocking Time)

Value1,160 ms

22/100

30%

CLS (Cumulative Layout Shift)

Value0.036

100/100

15%

TTI (Time to Interactive)

Value7.6 s

47/100

10%

Network Requests Diagram

pinolero.com

505 ms

sf.desktop.head.css

118 ms

sf.desktop.head.js

393 ms

layout_contemp.css

230 ms

category_7.css

120 ms

Our browser made a total of 87 requests to load all elements on the main page. We found that 86% of them (75 requests) were addressed to the original Pinolero.com, 3% (3 requests) were made to Facebook.com and 2% (2 requests) were made to Staticxx.facebook.com. The less responsive or slowest element that took the longest time to load (781 ms) belongs to the original domain Pinolero.com.

Page Optimization Overview & Recommendations

Page size can be reduced by 214.9 kB (11%)

Content Size

2.0 MB

After Optimization

1.8 MB

In fact, the total size of Pinolero.com main page is 2.0 MB. This result falls beyond the top 1M of websites and identifies a large and not optimized web page that may take ages to load. 30% of websites need less resources to load. Images take 1.7 MB which makes up the majority of the site volume.

HTML Optimization

-84%

Potential reduce by 64.3 kB

  • Original 76.3 kB
  • After minification 61.2 kB
  • After compression 11.9 kB

HTML content can be minified and compressed by a website’s server. The most efficient way is to compress content using GZIP which reduces data amount travelling through the network between server and browser. This page needs HTML code to be minified as it can gain 15.0 kB, which is 20% of the original size. It is highly recommended that content of this web page should be compressed using GZIP, as it can save up to 64.3 kB or 84% of the original size.

Image Optimization

-3%

Potential reduce by 45.5 kB

  • Original 1.7 MB
  • After minification 1.7 MB

Image size optimization can help to speed up a website loading time. The chart above shows the difference between the size before and after optimization. Pinolero images are well optimized though.

JavaScript Optimization

-67%

Potential reduce by 65.3 kB

  • Original 97.1 kB
  • After minification 96.8 kB
  • After compression 31.8 kB

It’s better to minify JavaScript in order to improve website performance. The diagram shows the current total size of all JavaScript files against the prospective JavaScript size after its minification and compression. It is highly recommended that all JavaScript files should be compressed and minified as it can save up to 65.3 kB or 67% of the original size.

CSS Optimization

-79%

Potential reduce by 39.7 kB

  • Original 50.0 kB
  • After minification 38.7 kB
  • After compression 10.3 kB

CSS files minification is very important to reduce a web page rendering time. The faster CSS files can load, the earlier a page can be rendered. Pinolero.com needs all CSS files to be minified and compressed as it can save up to 39.7 kB or 79% of the original size.

Requests Breakdown

Number of requests can be reduced by 26 (30%)

Requests Now

86

After Optimization

60

The browser has sent 86 CSS, Javascripts, AJAX and image requests in order to completely render the main page of Pinolero. We recommend that multiple CSS and JavaScript files should be merged into one by each type, as it can help reduce assets requests from 8 to 1 for JavaScripts and from 13 to 1 for CSS and as a result speed up the page load time.

Accessibility Review

pinolero.com accessibility score

83

Accessibility Issues

ARIA

These are opportunities to improve the usage of ARIA in your application which may enhance the experience for users of assistive technology, like a screen reader.

Impact

Issue

High

button, link, and menuitem elements do not have accessible names.

Names and labels

These are opportunities to improve the semantics of the controls in your application. This may enhance the experience for users of assistive technology, like a screen reader.

Impact

Issue

High

Buttons do not have an accessible name

High

Image elements do not have [alt] attributes

Navigation

These are opportunities to improve keyboard navigation in your application.

Impact

Issue

High

[id] attributes on active, focusable elements are not unique

High

Heading elements are not in a sequentially-descending order

Best Practices

pinolero.com best practices score

83

Areas of Improvement

Trust and Safety

Impact

Issue

High

Does not use HTTPS

Low

Ensure CSP is effective against XSS attacks

General

Impact

Issue

Low

Detected JavaScript libraries

High

Browser errors were logged to the console

High

Page has valid source maps

SEO Factors

pinolero.com SEO score

77

Search Engine Optimization Advices

Crawling and Indexing

To appear in search results, crawlers need access to your app.

Impact

Issue

High

Links are not crawlable

Content Best Practices

Format your HTML in a way that enables crawlers to better understand your app’s content.

Impact

Issue

High

Image elements do not have [alt] attributes

Mobile Friendly

Make sure your pages are mobile friendly so users don’t have to pinch or zoom in order to read the content pages. [Learn more](https://developers.google.com/search/mobile-sites/).

Impact

Issue

High

Document uses legible font sizes

Language and Encoding

  • Language Detected

    ES

  • Language Claimed

    EN

  • Encoding

    UTF-8

Language claimed in HTML meta tag should match the language actually used on the web page. Otherwise Pinolero.com can be misinterpreted by Google and other search engines. Our service has detected that Spanish is used on the page, and it does not match the claimed English language. Our system also found out that Pinolero.com main page’s claimed encoding is utf-8. Use of this encoding format is the best practice as the main page visitors from all over the world won’t have any issues with symbol transcription.

Social Sharing Optimization

Open Graph description is not detected on the main page of Pinolero. Lack of Open Graph description can be counter-productive for their social media presence, as such a description allows converting a website homepage (or other pages) into good-looking, rich and well-structured posts, when it is being shared on Facebook and other social media. For example, adding the following code snippet into HTML <head> tag will help to represent this web page correctly in social networks: