Report Summary

  • 23

    Performance

    Renders faster than
    42% of other websites

  • 71

    Accessibility

    Visual factors better than
    that of 37% of websites

  • 58

    Best Practices

    More advanced features
    available than in
    19% of websites

  • 89

    SEO

    Google-friendlier than
    67% of websites

timeline.ng

News and commentaries from Nigeria's finest journalists - TimelineNG

Page Load Speed

32.1 sec in total

First Response

13.7 sec

Resources Loaded

17.4 sec

Page Rendered

1 sec
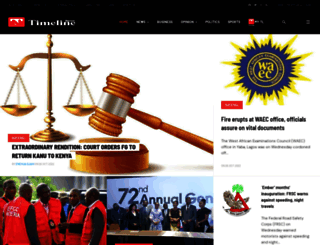
timeline.ng screenshot

About Website

Welcome to timeline.ng homepage info - get ready to check Timeline best content for Nigeria right away, or after learning these important things about timeline.ng

timeline.ng is a multimedia publishing channel committed to personalised, ethical and responsible reporting.

Visit timeline.ng

Key Findings

We analyzed Timeline.ng page load time and found that the first response time was 13.7 sec and then it took 18.4 sec to load all DOM resources and completely render a web page. This is a poor result, as 95% of websites can load faster.

Performance Metrics

timeline.ng performance score

23

Measured Metrics

name

value

score

weighting

FCP (First Contentful Paint)

Value5.5 s

6/100

10%

LCP (Largest Contentful Paint)

Value7.5 s

4/100

25%

SI (Speed Index)

Value6.6 s

38/100

10%

TBT (Total Blocking Time)

Value2,540 ms

4/100

30%

CLS (Cumulative Layout Shift)

Value0.057

98/100

15%

TTI (Time to Interactive)

Value12.3 s

15/100

10%

Network Requests Diagram

timeline.ng

13681 ms

wp-emoji-release.min.js

139 ms

style.css

152 ms

templates.css

165 ms

style.min.css

159 ms

Our browser made a total of 158 requests to load all elements on the main page. We found that 37% of them (59 requests) were addressed to the original Timeline.ng, 6% (10 requests) were made to Static.xx.fbcdn.net and 6% (9 requests) were made to Scontent.xx.fbcdn.net. The less responsive or slowest element that took the longest time to load (13.7 sec) belongs to the original domain Timeline.ng.

Page Optimization Overview & Recommendations

Page size can be reduced by 870.8 kB (41%)

Content Size

2.1 MB

After Optimization

1.2 MB

In fact, the total size of Timeline.ng main page is 2.1 MB. This result falls beyond the top 1M of websites and identifies a large and not optimized web page that may take ages to load. 75% of websites need less resources to load and that’s why Accessify’s recommendations for optimization and resource minification can be helpful for this project. Images take 1.0 MB which makes up the majority of the site volume.

HTML Optimization

-84%

Potential reduce by 199.2 kB

  • Original 237.5 kB
  • After minification 232.1 kB
  • After compression 38.3 kB

HTML content can be minified and compressed by a website’s server. The most efficient way is to compress content using GZIP which reduces data amount travelling through the network between server and browser. HTML code on this page is well minified. It is highly recommended that content of this web page should be compressed using GZIP, as it can save up to 199.2 kB or 84% of the original size.

Image Optimization

-14%

Potential reduce by 141.0 kB

  • Original 1.0 MB
  • After minification 866.5 kB

Image size optimization can help to speed up a website loading time. The chart above shows the difference between the size before and after optimization. Obviously, Timeline needs image optimization as it can save up to 141.0 kB or 14% of the original volume. The most popular and efficient tools for JPEG and PNG image optimization are Jpegoptim and PNG Crush.

JavaScript Optimization

-57%

Potential reduce by 405.8 kB

  • Original 709.3 kB
  • After minification 708.8 kB
  • After compression 303.5 kB

It’s better to minify JavaScript in order to improve website performance. The diagram shows the current total size of all JavaScript files against the prospective JavaScript size after its minification and compression. It is highly recommended that all JavaScript files should be compressed and minified as it can save up to 405.8 kB or 57% of the original size.

CSS Optimization

-81%

Potential reduce by 124.9 kB

  • Original 154.6 kB
  • After minification 143.4 kB
  • After compression 29.7 kB

CSS files minification is very important to reduce a web page rendering time. The faster CSS files can load, the earlier a page can be rendered. Timeline.ng needs all CSS files to be minified and compressed as it can save up to 124.9 kB or 81% of the original size.

Requests Breakdown

Number of requests can be reduced by 62 (42%)

Requests Now

148

After Optimization

86

The browser has sent 148 CSS, Javascripts, AJAX and image requests in order to completely render the main page of Timeline. We recommend that multiple CSS and JavaScript files should be merged into one by each type, as it can help reduce assets requests from 34 to 1 for JavaScripts and from 9 to 1 for CSS and as a result speed up the page load time.

Accessibility Review

timeline.ng accessibility score

71

Accessibility Issues

ARIA

These are opportunities to improve the usage of ARIA in your application which may enhance the experience for users of assistive technology, like a screen reader.

Impact

Issue

High

[aria-*] attributes do not match their roles

High

button, link, and menuitem elements do not have accessible names.

Contrast

These are opportunities to improve the legibility of your content.

Impact

Issue

High

Background and foreground colors do not have a sufficient contrast ratio.

Names and labels

These are opportunities to improve the semantics of the controls in your application. This may enhance the experience for users of assistive technology, like a screen reader.

Impact

Issue

High

<frame> or <iframe> elements do not have a title

High

Image elements do not have [alt] attributes

High

Links do not have a discernible name

Best practices

These items highlight common accessibility best practices.

Impact

Issue

High

[user-scalable="no"] is used in the <meta name="viewport"> element or the [maximum-scale] attribute is less than 5.

Best Practices

timeline.ng best practices score

58

Areas of Improvement

Trust and Safety

Impact

Issue

High

Does not use HTTPS

High

Includes front-end JavaScript libraries with known security vulnerabilities

Low

Ensure CSP is effective against XSS attacks

User Experience

Impact

Issue

High

Serves images with low resolution

General

Impact

Issue

Low

Detected JavaScript libraries

High

Browser errors were logged to the console

High

Missing source maps for large first-party JavaScript

High

Issues were logged in the Issues panel in Chrome Devtools

SEO Factors

timeline.ng SEO score

89

Search Engine Optimization Advices

Content Best Practices

Format your HTML in a way that enables crawlers to better understand your app’s content.

Impact

Issue

High

Image elements do not have [alt] attributes

Mobile Friendly

Make sure your pages are mobile friendly so users don’t have to pinch or zoom in order to read the content pages. [Learn more](https://developers.google.com/search/mobile-sites/).

Impact

Issue

High

Document uses legible font sizes

High

Tap targets are not sized appropriately

Language and Encoding

  • Language Detected

    EN

  • Language Claimed

    EN

  • Encoding

    UTF-8

Language claimed in HTML meta tag should match the language actually used on the web page. Otherwise Timeline.ng can be misinterpreted by Google and other search engines. Our service has detected that English is used on the page, and it matches the claimed language. Our system also found out that Timeline.ng main page’s claimed encoding is utf-8. Use of this encoding format is the best practice as the main page visitors from all over the world won’t have any issues with symbol transcription.

Social Sharing Optimization

Open Graph data is detected on the main page of Timeline. This is the best way to make the web page social media friendly. Here is how it looks like on Facebook: