9.7 sec in total
843 ms
8.6 sec
251 ms
Click here to check amazing Visual Renders content for South Africa. Otherwise, check out these important facts you probably never knew about visualrenders.com
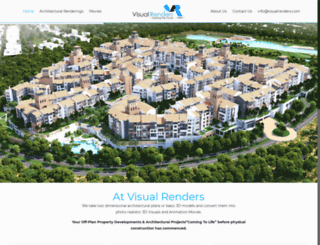
Imagine your Architectural Project ‘coming to life’ even before physical construction has commenced!
Visit visualrenders.comWe analyzed Visualrenders.com page load time and found that the first response time was 843 ms and then it took 8.8 sec to load all DOM resources and completely render a web page. This is a poor result, as 85% of websites can load faster.
visualrenders.com performance score
name
value
score
weighting
Value9.3 s
0/100
10%
Value10.0 s
0/100
25%
Value22.1 s
0/100
10%
Value780 ms
37/100
30%
Value0.012
100/100
15%
Value28.5 s
0/100
10%
843 ms
1444 ms
27 ms
281 ms
531 ms
Our browser made a total of 77 requests to load all elements on the main page. We found that 86% of them (66 requests) were addressed to the original Visualrenders.com, 6% (5 requests) were made to Fonts.gstatic.com and 4% (3 requests) were made to Fonts.googleapis.com. The less responsive or slowest element that took the longest time to load (4.1 sec) belongs to the original domain Visualrenders.com.
Page size can be reduced by 84.5 kB (7%)
1.2 MB
1.1 MB
In fact, the total size of Visualrenders.com main page is 1.2 MB. This result falls beyond the top 1M of websites and identifies a large and not optimized web page that may take ages to load. 55% of websites need less resources to load. Images take 1.1 MB which makes up the majority of the site volume.
Potential reduce by 42.6 kB
HTML content can be minified and compressed by a website’s server. The most efficient way is to compress content using GZIP which reduces data amount travelling through the network between server and browser. HTML code on this page is well minified. It is highly recommended that content of this web page should be compressed using GZIP, as it can save up to 42.6 kB or 78% of the original size.
Potential reduce by 10.0 kB
Image size optimization can help to speed up a website loading time. The chart above shows the difference between the size before and after optimization. Visual Renders images are well optimized though.
Potential reduce by 32.0 kB
It’s better to minify JavaScript in order to improve website performance. The diagram shows the current total size of all JavaScript files against the prospective JavaScript size after its minification and compression. It is highly recommended that all JavaScript files should be compressed and minified as it can save up to 32.0 kB or 60% of the original size.
Number of requests can be reduced by 48 (70%)
69
21
The browser has sent 69 CSS, Javascripts, AJAX and image requests in order to completely render the main page of Visual Renders. We recommend that multiple CSS and JavaScript files should be merged into one by each type, as it can help reduce assets requests from 24 to 1 for JavaScripts and from 26 to 1 for CSS and as a result speed up the page load time.
visualrenders.com
843 ms
www.visualrenders.com
1444 ms
analytics.js
27 ms
wp-emoji-release.min.js
281 ms
layerslider.css
531 ms
css
27 ms
styles.css
534 ms
tp_twitter_plugin.css
534 ms
settings.css
536 ms
style.css
543 ms
base.css
544 ms
buttons.css
795 ms
mfn-icons.css
799 ms
grid.css
797 ms
layout.css
1066 ms
shortcodes.css
1084 ms
variables.css
807 ms
style-simple.css
1058 ms
animations.min.css
1062 ms
colorpicker.css
1060 ms
jquery.ui.all.css
1073 ms
jplayer.blue.monday.css
1321 ms
prettyPhoto.css
1324 ms
responsive-1240.css
1327 ms
responsive.css
1331 ms
style-colors.php
1738 ms
style.php
1742 ms
css
41 ms
css
54 ms
custom.css
1582 ms
jquery.js
3260 ms
jquery-migrate.min.js
1586 ms
layerslider.kreaturamedia.jquery.js
1857 ms
greensock.js
3228 ms
layerslider.transitions.js
2704 ms
jquery.themepunch.tools.min.js
2531 ms
jquery.themepunch.revolution.min.js
2284 ms
jquery.form.min.js
2120 ms
scripts.js
4132 ms
core.min.js
2554 ms
widget.min.js
2795 ms
mouse.min.js
2823 ms
collect
3 ms
collect
61 ms
sortable.min.js
2695 ms
tabs.min.js
2532 ms
accordion.min.js
3408 ms
animations.min.js
3239 ms
jquery.jplayer.min.js
2800 ms
colorpicker.js
2956 ms
jquery.plugins.js
3514 ms
mfn.menu.js
2803 ms
scripts.js
2968 ms
comment-reply.min.js
3060 ms
Untitled-11.png
969 ms
box_shadow.png
715 ms
US.png
926 ms
2Q-AW1e_taO6pHwMXcXW5w.ttf
14 ms
OsJ2DjdpjqFRVUSto6IffKCWcynf_cDxXwCLxiixG1c.ttf
34 ms
_aijTyevf54tkVDLy-dlnKCWcynf_cDxXwCLxiixG1c.ttf
33 ms
0ihfXUL2emPh0ROJezvraKCWcynf_cDxXwCLxiixG1c.ttf
13 ms
Visual-Renders-front-Page-3D-Rendering-Sample-1.jpg
2563 ms
Visual-Renders-front-Page-3D-Rendering-Sample-8.jpg
2016 ms
Visual-Renders-front-Page-3D-Rendering-Sample-3.jpg
2041 ms
Visual-Renders-front-Page-3D-Rendering-Sample-4.jpg
2938 ms
Visual-Renders-front-Page-3D-Rendering-Sample-5.jpg
2128 ms
Visual-Renders-front-Page-3D-Rendering-Sample-6.jpg
2008 ms
Visual-Renders-front-Page-3D-Rendering-Sample-7.jpg
2535 ms
Visual-Renders-front-Page-3D-Rendering-Sample-2.jpg
2803 ms
download.jpeg
2304 ms
top_bar_right_shadow.png
2390 ms
box_shadow_button.png
2556 ms
ISUraQdBYMI3VoDzBxXqNvesZW2xOQ-xsNqO47m55DA.ttf
4 ms
mfn-icons.woff
2624 ms
loader.gif
1884 ms
tp-leftarrow.png
1917 ms
tp-rightarrow.png
1915 ms
visualrenders.com accessibility score
Contrast
These are opportunities to improve the legibility of your content.
Impact
Issue
Background and foreground colors do not have a sufficient contrast ratio.
Navigation
These are opportunities to improve keyboard navigation in your application.
Impact
Issue
Heading elements are not in a sequentially-descending order
Names and labels
These are opportunities to improve the semantics of the controls in your application. This may enhance the experience for users of assistive technology, like a screen reader.
Impact
Issue
Links do not have a discernible name
Best practices
These items highlight common accessibility best practices.
Impact
Issue
[user-scalable="no"] is used in the <meta name="viewport"> element or the [maximum-scale] attribute is less than 5.
visualrenders.com best practices score
Trust and Safety
Impact
Issue
Does not use HTTPS
Includes front-end JavaScript libraries with known security vulnerabilities
Ensure CSP is effective against XSS attacks
General
Impact
Issue
Detected JavaScript libraries
visualrenders.com SEO score
Crawling and Indexing
To appear in search results, crawlers need access to your app.
Impact
Issue
Links are not crawlable
Mobile Friendly
Make sure your pages are mobile friendly so users don’t have to pinch or zoom in order to read the content pages. [Learn more](https://developers.google.com/search/mobile-sites/).
Impact
Issue
Document uses legible font sizes
Tap targets are not sized appropriately
EN
EN
UTF-8
Language claimed in HTML meta tag should match the language actually used on the web page. Otherwise Visualrenders.com can be misinterpreted by Google and other search engines. Our service has detected that English is used on the page, and it matches the claimed language. Our system also found out that Visualrenders.com main page’s claimed encoding is utf-8. Use of this encoding format is the best practice as the main page visitors from all over the world won’t have any issues with symbol transcription.
visualrenders.com
Open Graph description is not detected on the main page of Visual Renders. Lack of Open Graph description can be counter-productive for their social media presence, as such a description allows converting a website homepage (or other pages) into good-looking, rich and well-structured posts, when it is being shared on Facebook and other social media. For example, adding the following code snippet into HTML <head> tag will help to represent this web page correctly in social networks: