Report Summary

  • 4

    Performance

    Renders faster than
    20% of other websites

  • 69

    Accessibility

    Visual factors better than
    that of 35% of websites

  • 58

    Best Practices

    More advanced features
    available than in
    19% of websites

  • 81

    SEO

    Google-friendlier than
    43% of websites

a12.com

A12 - Conectados pela Fé

Page Load Speed

32.4 sec in total

First Response

5.5 sec

Resources Loaded

26.4 sec

Page Rendered

422 ms
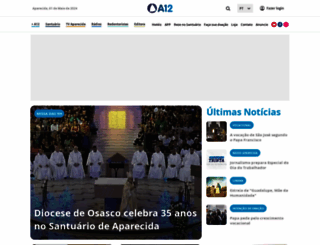
a12.com screenshot

About Website

Visit a12.com now to see the best up-to-date A12 content for Brazil and also check out these interesting facts you probably never knew about a12.com

A12.com - Site oficial do Santuário Nacional de Aparecida, que traz notícias católicas, formação religiosa, liturgia diária, vela virtual, vídeos e mais conteúdos da Rede Aparecida de Comunicação.

Visit a12.com

Key Findings

We analyzed A12.com page load time and found that the first response time was 5.5 sec and then it took 26.9 sec to load all DOM resources and completely render a web page. This is a poor result, as 95% of websites can load faster.

Performance Metrics

a12.com performance score

4

Measured Metrics

name

value

score

weighting

FCP (First Contentful Paint)

Value4.0 s

22/100

10%

LCP (Largest Contentful Paint)

Value22.5 s

0/100

25%

SI (Speed Index)

Value10.4 s

8/100

10%

TBT (Total Blocking Time)

Value3,120 ms

2/100

30%

CLS (Cumulative Layout Shift)

Value1.021

2/100

15%

TTI (Time to Interactive)

Value23.9 s

1/100

10%

Network Requests Diagram

www.a12.com

5492 ms

css

87 ms

plugins.min.css

393 ms

app.min.css

527 ms

maintemp.css

266 ms

Our browser made a total of 110 requests to load all elements on the main page. We found that 93% of them (102 requests) were addressed to the original A12.com, 2% (2 requests) were made to Google-analytics.com and 2% (2 requests) were made to Apis.google.com. The less responsive or slowest element that took the longest time to load (5.5 sec) belongs to the original domain A12.com.

Page Optimization Overview & Recommendations

Page size can be reduced by 94.1 kB (55%)

Content Size

169.7 kB

After Optimization

75.6 kB

In fact, the total size of A12.com main page is 169.7 kB. This result falls beyond the top 1M of websites and identifies a large and not optimized web page that may take ages to load. 50% of websites need less resources to load. HTML takes 102.7 kB which makes up the majority of the site volume.

HTML Optimization

-85%

Potential reduce by 87.0 kB

  • Original 102.7 kB
  • After minification 94.0 kB
  • After compression 15.7 kB

HTML content can be minified and compressed by a website’s server. The most efficient way is to compress content using GZIP which reduces data amount travelling through the network between server and browser. HTML code on this page is well minified. It is highly recommended that content of this web page should be compressed using GZIP, as it can save up to 87.0 kB or 85% of the original size.

Image Optimization

-3%

Potential reduce by 1.4 kB

  • Original 41.1 kB
  • After minification 39.7 kB

Image size optimization can help to speed up a website loading time. The chart above shows the difference between the size before and after optimization. A12 images are well optimized though.

JavaScript Optimization

-22%

Potential reduce by 5.7 kB

  • Original 25.9 kB
  • After minification 25.9 kB
  • After compression 20.2 kB

It’s better to minify JavaScript in order to improve website performance. The diagram shows the current total size of all JavaScript files against the prospective JavaScript size after its minification and compression. It is highly recommended that all JavaScript files should be compressed and minified as it can save up to 5.7 kB or 22% of the original size.

Requests Breakdown

Number of requests can be reduced by 40 (37%)

Requests Now

107

After Optimization

67

The browser has sent 107 CSS, Javascripts, AJAX and image requests in order to completely render the main page of A12. We recommend that multiple CSS and JavaScript files should be merged into one by each type, as it can help reduce assets requests from 15 to 1 for JavaScripts and from 16 to 1 for CSS and as a result speed up the page load time.

Accessibility Review

a12.com accessibility score

69

Accessibility Issues

Contrast

These are opportunities to improve the legibility of your content.

Impact

Issue

High

Background and foreground colors do not have a sufficient contrast ratio.

Navigation

These are opportunities to improve keyboard navigation in your application.

Impact

Issue

High

[id] attributes on active, focusable elements are not unique

Internationalization and localization

These are opportunities to improve the interpretation of your content by users in different locales.

Impact

Issue

High

<html> element does not have a [lang] attribute

Names and labels

These are opportunities to improve the semantics of the controls in your application. This may enhance the experience for users of assistive technology, like a screen reader.

Impact

Issue

High

Image elements do not have [alt] attributes

High

Form elements do not have associated labels

High

Links do not have a discernible name

Tables and lists

These are opportunities to improve the experience of reading tabular or list data using assistive technology, like a screen reader.

Impact

Issue

High

Lists do not contain only <li> elements and script supporting elements (<script> and <template>).

High

List items (<li>) are not contained within <ul> or <ol> parent elements.

Best Practices

a12.com best practices score

58

Areas of Improvement

Trust and Safety

Impact

Issue

High

Does not use HTTPS

High

Includes front-end JavaScript libraries with known security vulnerabilities

Low

Ensure CSP is effective against XSS attacks

User Experience

Impact

Issue

High

Displays images with incorrect aspect ratio

High

Serves images with low resolution

General

Impact

Issue

Low

Detected JavaScript libraries

High

Browser errors were logged to the console

High

Missing source maps for large first-party JavaScript

SEO Factors

a12.com SEO score

81

Search Engine Optimization Advices

Crawling and Indexing

To appear in search results, crawlers need access to your app.

Impact

Issue

High

Links are not crawlable

Content Best Practices

Format your HTML in a way that enables crawlers to better understand your app’s content.

Impact

Issue

High

Image elements do not have [alt] attributes

Mobile Friendly

Make sure your pages are mobile friendly so users don’t have to pinch or zoom in order to read the content pages. [Learn more](https://developers.google.com/search/mobile-sites/).

Impact

Issue

High

Document uses legible font sizes

High

Tap targets are not sized appropriately

Language and Encoding

  • Language Detected

    PT

  • Language Claimed

    UT

  • Encoding

    UTF-8

Language claimed in HTML meta tag should match the language actually used on the web page. Otherwise A12.com can be misinterpreted by Google and other search engines. Our service has detected that Portuguese is used on the page, and it does not match the claimed language. Our system also found out that A12.com main page’s claimed encoding is utf-8. Use of this encoding format is the best practice as the main page visitors from all over the world won’t have any issues with symbol transcription.

Social Sharing Optimization

Open Graph description is not detected on the main page of A12. Lack of Open Graph description can be counter-productive for their social media presence, as such a description allows converting a website homepage (or other pages) into good-looking, rich and well-structured posts, when it is being shared on Facebook and other social media. For example, adding the following code snippet into HTML <head> tag will help to represent this web page correctly in social networks: