Report Summary

  • 78

    Performance

    Renders faster than
    85% of other websites

  • 75

    Accessibility

    Visual factors better than
    that of 42% of websites

  • 92

    Best Practices

    More advanced features
    available than in
    81% of websites

  • 94

    SEO

    Google-friendlier than
    90% of websites

azhibo.com

A直播 - NBA直播,足球直播,CBA直播,免费在线直播

Page Load Speed

16.1 sec in total

First Response

504 ms

Resources Loaded

14.5 sec

Page Rendered

1.1 sec
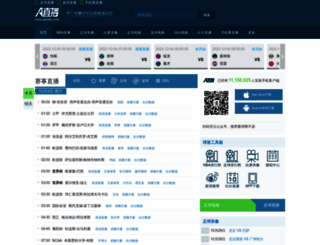
azhibo.com screenshot

About Website

Welcome to azhibo.com homepage info - get ready to check Azhibo best content for China right away, or after learning these important things about azhibo.com

A直播更用心提供比直播吧等体育直播网站更优质的NBA直播、足球直播、CBA直播,在A直播可显著看到比直播吧所提供比赛更齐全、多直播源更准确、无插件观看更方便!

Visit azhibo.com

Key Findings

We analyzed Azhibo.com page load time and found that the first response time was 504 ms and then it took 15.6 sec to load all DOM resources and completely render a web page. This is a poor result, as 90% of websites can load faster.

Performance Metrics

azhibo.com performance score

78

Measured Metrics

name

value

score

weighting

FCP (First Contentful Paint)

Value2.8 s

55/100

10%

LCP (Largest Contentful Paint)

Value2.8 s

82/100

25%

SI (Speed Index)

Value5.8 s

50/100

10%

TBT (Total Blocking Time)

Value300 ms

78/100

30%

CLS (Cumulative Layout Shift)

Value0.01

100/100

15%

TTI (Time to Interactive)

Value4.3 s

84/100

10%

Network Requests Diagram

azhibo.com

504 ms

www.azhibo.com

706 ms

web.css

15 ms

m.js

711 ms

isMobile.min.js

14 ms

Our browser made a total of 96 requests to load all elements on the main page. We found that 50% of them (48 requests) were addressed to the original Azhibo.com, 6% (6 requests) were made to Images.azhibo.com and 6% (6 requests) were made to Pos.baidu.com. The less responsive or slowest element that took the longest time to load (10.3 sec) relates to the external source Img1.hupucdn.com.

Page Optimization Overview & Recommendations

Page size can be reduced by 846.6 kB (63%)

Content Size

1.3 MB

After Optimization

498.2 kB

In fact, the total size of Azhibo.com main page is 1.3 MB. This result falls beyond the top 1M of websites and identifies a large and not optimized web page that may take ages to load. 50% of websites need less resources to load. HTML takes 505.6 kB which makes up the majority of the site volume.

HTML Optimization

-94%

Potential reduce by 475.1 kB

  • Original 505.6 kB
  • After minification 244.2 kB
  • After compression 30.5 kB

HTML content can be minified and compressed by a website’s server. The most efficient way is to compress content using GZIP which reduces data amount travelling through the network between server and browser. This page needs HTML code to be minified as it can gain 261.4 kB, which is 52% of the original size. It is highly recommended that content of this web page should be compressed using GZIP, as it can save up to 475.1 kB or 94% of the original size.

Image Optimization

-8%

Potential reduce by 25.0 kB

  • Original 315.4 kB
  • After minification 290.3 kB

Image size optimization can help to speed up a website loading time. The chart above shows the difference between the size before and after optimization. Azhibo images are well optimized though.

JavaScript Optimization

-62%

Potential reduce by 259.3 kB

  • Original 419.0 kB
  • After minification 414.7 kB
  • After compression 159.7 kB

It’s better to minify JavaScript in order to improve website performance. The diagram shows the current total size of all JavaScript files against the prospective JavaScript size after its minification and compression. It is highly recommended that all JavaScript files should be compressed and minified as it can save up to 259.3 kB or 62% of the original size.

CSS Optimization

-83%

Potential reduce by 87.2 kB

  • Original 104.8 kB
  • After minification 104.8 kB
  • After compression 17.6 kB

CSS files minification is very important to reduce a web page rendering time. The faster CSS files can load, the earlier a page can be rendered. Azhibo.com needs all CSS files to be minified and compressed as it can save up to 87.2 kB or 83% of the original size.

Requests Breakdown

Number of requests can be reduced by 40 (47%)

Requests Now

86

After Optimization

46

The browser has sent 86 CSS, Javascripts, AJAX and image requests in order to completely render the main page of Azhibo. We recommend that multiple CSS and JavaScript files should be merged into one by each type, as it can help reduce assets requests from 22 to 1 for JavaScripts and as a result speed up the page load time.

Accessibility Review

azhibo.com accessibility score

75

Accessibility Issues

Contrast

These are opportunities to improve the legibility of your content.

Impact

Issue

High

Background and foreground colors do not have a sufficient contrast ratio.

Internationalization and localization

These are opportunities to improve the interpretation of your content by users in different locales.

Impact

Issue

High

<html> element does not have a [lang] attribute

Best practices

These items highlight common accessibility best practices.

Impact

Issue

High

[user-scalable="no"] is used in the <meta name="viewport"> element or the [maximum-scale] attribute is less than 5.

Best Practices

azhibo.com best practices score

92

Areas of Improvement

Trust and Safety

Impact

Issue

High

Does not use HTTPS

Low

Ensure CSP is effective against XSS attacks

General

Impact

Issue

Low

Detected JavaScript libraries

SEO Factors

azhibo.com SEO score

94

Search Engine Optimization Advices

Mobile Friendly

Make sure your pages are mobile friendly so users don’t have to pinch or zoom in order to read the content pages. [Learn more](https://developers.google.com/search/mobile-sites/).

Impact

Issue

High

Document uses legible font sizes

High

Tap targets are not sized appropriately

Language and Encoding

  • Language Detected

    ZH

  • Language Claimed

    N/A

  • Encoding

    UTF-8

Language claimed in HTML meta tag should match the language actually used on the web page. Otherwise Azhibo.com can be misinterpreted by Google and other search engines. Our service has detected that Chinese is used on the page, and neither this language nor any other was claimed in <html> or <meta> tags. Our system also found out that Azhibo.com main page’s claimed encoding is utf-8. Use of this encoding format is the best practice as the main page visitors from all over the world won’t have any issues with symbol transcription.

Social Sharing Optimization

Open Graph description is not detected on the main page of Azhibo. Lack of Open Graph description can be counter-productive for their social media presence, as such a description allows converting a website homepage (or other pages) into good-looking, rich and well-structured posts, when it is being shared on Facebook and other social media. For example, adding the following code snippet into HTML <head> tag will help to represent this web page correctly in social networks: