Report Summary

  • 21

    Performance

    Renders faster than
    39% of other websites

  • 96

    Accessibility

    Visual factors better than
    that of 89% of websites

  • 75

    Best Practices

    More advanced features
    available than in
    36% of websites

  • 100

    SEO

    Google-friendlier than
    95% of websites

demos.artbees.net

Jupiter X WordPress Website Builder - Official Demo

Page Load Speed

6.5 sec in total

First Response

114 ms

Resources Loaded

3.1 sec

Page Rendered

3.3 sec
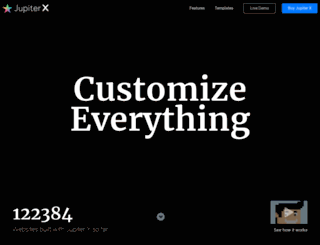
demos.artbees.net screenshot

About Website

Visit demos.artbees.net now to see the best up-to-date Demo S Artbees content for India and also check out these interesting facts you probably never knew about demos.artbees.net

Try a decade’s go-to WordPress website builder now with all-new design, mind-blowing new features and a huge leap in WooCommerce capabilities.

Visit demos.artbees.net

Key Findings

We analyzed Demos.artbees.net page load time and found that the first response time was 114 ms and then it took 6.4 sec to load all DOM resources and completely render a web page. This is a poor result, as 80% of websites can load faster.

Performance Metrics

demos.artbees.net performance score

21

Measured Metrics

name

value

score

weighting

FCP (First Contentful Paint)

Value5.1 s

8/100

10%

LCP (Largest Contentful Paint)

Value6.0 s

13/100

25%

SI (Speed Index)

Value8.8 s

16/100

10%

TBT (Total Blocking Time)

Value4,120 ms

1/100

30%

CLS (Cumulative Layout Shift)

Value0.023

100/100

15%

TTI (Time to Interactive)

Value22.8 s

1/100

10%

Network Requests Diagram

114 ms

pre-loader.png

100 ms

v5-logo.svg

56 ms

star.png

60 ms

5.png

61 ms

Our browser made a total of 185 requests to load all elements on the main page. We found that 6% of them (11 requests) were addressed to the original Demos.artbees.net, 86% (160 requests) were made to Demos.artbees1.netdna-cdn.com and 5% (10 requests) were made to Use.typekit.net. The less responsive or slowest element that took the longest time to load (1.4 sec) relates to the external source Use.typekit.net.

Page Optimization Overview & Recommendations

Page size can be reduced by 1.8 MB (30%)

Content Size

6.1 MB

After Optimization

4.2 MB

In fact, the total size of Demos.artbees.net main page is 6.1 MB. This result falls beyond the top 1M of websites and identifies a large and not optimized web page that may take ages to load. 85% of websites need less resources to load and that’s why Accessify’s recommendations for optimization and resource minification can be helpful for this project. Images take 3.9 MB which makes up the majority of the site volume.

HTML Optimization

-89%

Potential reduce by 180.9 kB

  • Original 202.7 kB
  • After minification 201.5 kB
  • After compression 21.8 kB

HTML content can be minified and compressed by a website’s server. The most efficient way is to compress content using GZIP which reduces data amount travelling through the network between server and browser. HTML code on this page is well minified. It is highly recommended that content of this web page should be compressed using GZIP, as it can save up to 180.9 kB or 89% of the original size.

Image Optimization

-0%

Potential reduce by 3.2 kB

  • Original 3.9 MB
  • After minification 3.9 MB

Image size optimization can help to speed up a website loading time. The chart above shows the difference between the size before and after optimization. Demo S Artbees images are well optimized though.

JavaScript Optimization

-66%

Potential reduce by 356.6 kB

  • Original 537.7 kB
  • After minification 536.9 kB
  • After compression 181.2 kB

It’s better to minify JavaScript in order to improve website performance. The diagram shows the current total size of all JavaScript files against the prospective JavaScript size after its minification and compression. It is highly recommended that all JavaScript files should be compressed and minified as it can save up to 356.6 kB or 66% of the original size.

CSS Optimization

-89%

Potential reduce by 1.3 MB

  • Original 1.5 MB
  • After minification 1.4 MB
  • After compression 163.4 kB

CSS files minification is very important to reduce a web page rendering time. The faster CSS files can load, the earlier a page can be rendered. Demos.artbees.net needs all CSS files to be minified and compressed as it can save up to 1.3 MB or 89% of the original size.

Requests Breakdown

Number of requests can be reduced by 46 (26%)

Requests Now

174

After Optimization

128

The browser has sent 174 CSS, Javascripts, AJAX and image requests in order to completely render the main page of Demo S Artbees. We recommend that multiple CSS and JavaScript files should be merged into one by each type, as it can help reduce assets requests from 22 to 1 for JavaScripts and from 13 to 1 for CSS and as a result speed up the page load time.

Accessibility Review

demos.artbees.net accessibility score

96

Accessibility Issues

Contrast

These are opportunities to improve the legibility of your content.

Impact

Issue

High

Background and foreground colors do not have a sufficient contrast ratio.

Navigation

These are opportunities to improve keyboard navigation in your application.

Impact

Issue

High

Heading elements are not in a sequentially-descending order

Best Practices

demos.artbees.net best practices score

75

Areas of Improvement

Trust and Safety

Impact

Issue

High

Does not use HTTPS

High

Includes front-end JavaScript libraries with known security vulnerabilities

Low

Ensure CSP is effective against XSS attacks

User Experience

Impact

Issue

High

Displays images with incorrect aspect ratio

General

Impact

Issue

Low

Detected JavaScript libraries

High

Missing source maps for large first-party JavaScript

SEO Factors

demos.artbees.net SEO score

100

Search Engine Optimization Advices

Mobile Friendly

Make sure your pages are mobile friendly so users don’t have to pinch or zoom in order to read the content pages. [Learn more](https://developers.google.com/search/mobile-sites/).

Impact

Issue

High

Document uses legible font sizes

Language and Encoding

  • Language Detected

    EN

  • Language Claimed

    EN

  • Encoding

    UTF-8

Language claimed in HTML meta tag should match the language actually used on the web page. Otherwise Demos.artbees.net can be misinterpreted by Google and other search engines. Our service has detected that English is used on the page, and it matches the claimed language. Our system also found out that Demos.artbees.net main page’s claimed encoding is utf-8. Use of this encoding format is the best practice as the main page visitors from all over the world won’t have any issues with symbol transcription.

Social Sharing Optimization

Open Graph data is detected on the main page of Demo S Artbees. This is the best way to make the web page social media friendly. Here is how it looks like on Facebook: