Report Summary

  • 0

    Performance

  • 0

    Accessibility

  • 0

    Best Practices

  • 0

    SEO

responsetester.appspot.com

Server Response Code Checker

Page Load Speed

1.2 sec in total

First Response

113 ms

Resources Loaded

958 ms

Page Rendered

176 ms

responsetester.appspot.com screenshot

About Website

Visit responsetester.appspot.com now to see the best up-to-date Response Tester Appspot content for Japan and also check out these interesting facts you probably never knew about responsetester.appspot.com

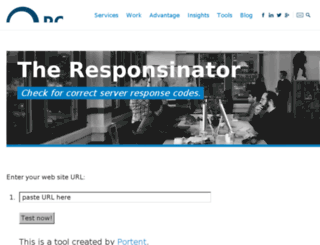
Check for correct server response codes.

Visit responsetester.appspot.com

Key Findings

We analyzed Responsetester.appspot.com page load time and found that the first response time was 113 ms and then it took 1.1 sec to load all DOM resources and completely render a web page. This is quite a good result, as only 20% of websites can load faster. This domain responded with an error, which can significantly jeopardize Responsetester.appspot.com rating and web reputation

Performance Metrics

responsetester.appspot.com performance score

0

Network Requests Diagram

responsetester.appspot.com

113 ms

dashicons.min.css

148 ms

thickbox.css

80 ms

bootstrap.css

223 ms

bootstrap-custom.css

262 ms

Our browser made a total of 57 requests to load all elements on the main page. We found that 2% of them (1 request) were addressed to the original Responsetester.appspot.com, 61% (35 requests) were made to Portent.com and 7% (4 requests) were made to Google-analytics.com. The less responsive or slowest element that took the longest time to load (314 ms) relates to the external source Portent.com.

Page Optimization Overview & Recommendations

Page size can be reduced by 653.7 kB (65%)

Content Size

1.0 MB

After Optimization

356.1 kB

In fact, the total size of Responsetester.appspot.com main page is 1.0 MB. This result falls beyond the top 1M of websites and identifies a large and not optimized web page that may take ages to load. 35% of websites need less resources to load. CSS take 458.4 kB which makes up the majority of the site volume.

HTML Optimization

-86%

Potential reduce by 47.0 kB

  • Original 54.7 kB
  • After minification 51.8 kB
  • After compression 7.8 kB

HTML content can be minified and compressed by a website’s server. The most efficient way is to compress content using GZIP which reduces data amount travelling through the network between server and browser. HTML code on this page is well minified. It is highly recommended that content of this web page should be compressed using GZIP, as it can save up to 47.0 kB or 86% of the original size.

Image Optimization

-0%

Potential reduce by 0 B

  • Original 150.3 kB
  • After minification 150.3 kB

Image size optimization can help to speed up a website loading time. The chart above shows the difference between the size before and after optimization. Response Tester Appspot images are well optimized though.

JavaScript Optimization

-71%

Potential reduce by 247.0 kB

  • Original 346.4 kB
  • After minification 267.1 kB
  • After compression 99.4 kB

It’s better to minify JavaScript in order to improve website performance. The diagram shows the current total size of all JavaScript files against the prospective JavaScript size after its minification and compression. It is highly recommended that all JavaScript files should be compressed and minified as it can save up to 247.0 kB or 71% of the original size.

CSS Optimization

-78%

Potential reduce by 359.7 kB

  • Original 458.4 kB
  • After minification 376.4 kB
  • After compression 98.7 kB

CSS files minification is very important to reduce a web page rendering time. The faster CSS files can load, the earlier a page can be rendered. Responsetester.appspot.com needs all CSS files to be minified and compressed as it can save up to 359.7 kB or 78% of the original size.

Requests Breakdown

Number of requests can be reduced by 29 (58%)

Requests Now

50

After Optimization

21

The browser has sent 50 CSS, Javascripts, AJAX and image requests in order to completely render the main page of Response Tester Appspot. We recommend that multiple CSS and JavaScript files should be merged into one by each type, as it can help reduce assets requests from 18 to 1 for JavaScripts and from 7 to 1 for CSS and as a result speed up the page load time.

SEO Factors

responsetester.appspot.com SEO score

0

Language and Encoding

  • Language Detected

    EN

  • Language Claimed

    EN

  • Encoding

    UTF-8

Language claimed in HTML meta tag should match the language actually used on the web page. Otherwise Responsetester.appspot.com can be misinterpreted by Google and other search engines. Our service has detected that English is used on the page, and it matches the claimed language. Our system also found out that Responsetester.appspot.com main page’s claimed encoding is utf-8. Use of this encoding format is the best practice as the main page visitors from all over the world won’t have any issues with symbol transcription.

Social Sharing Optimization

Open Graph data is detected on the main page of Response Tester Appspot. This is the best way to make the web page social media friendly. Here is how it looks like on Facebook: