8.7 sec in total
129 ms
8 sec
634 ms
Click here to check amazing Bandwidth content. Otherwise, check out these important facts you probably never knew about bandwidth.team
Recruiting the right talent is key for business growth. Let our team at Bandwidth, a Seattle recruiting and staffing company, deliver the best candidate for you
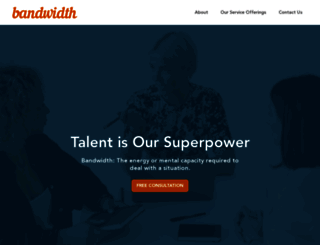
Visit bandwidth.teamWe analyzed Bandwidth.team page load time and found that the first response time was 129 ms and then it took 8.6 sec to load all DOM resources and completely render a web page. This is a poor result, as 85% of websites can load faster.
bandwidth.team performance score
name
value
score
weighting
Value3.9 s
25/100
10%
Value14.4 s
0/100
25%
Value12.5 s
3/100
10%
Value5,230 ms
0/100
30%
Value0
100/100
15%
Value14.3 s
9/100
10%
129 ms
2738 ms
298 ms
495 ms
129 ms
Our browser made a total of 84 requests to load all elements on the main page. We found that 80% of them (67 requests) were addressed to the original Bandwidth.team, 7% (6 requests) were made to Fonts.gstatic.com and 4% (3 requests) were made to Googletagmanager.com. The less responsive or slowest element that took the longest time to load (2.7 sec) belongs to the original domain Bandwidth.team.
Page size can be reduced by 158.9 kB (13%)
1.2 MB
1.1 MB
In fact, the total size of Bandwidth.team main page is 1.2 MB. This result falls beyond the top 1M of websites and identifies a large and not optimized web page that may take ages to load. 80% of websites need less resources to load and that’s why Accessify’s recommendations for optimization and resource minification can be helpful for this project. Images take 711.4 kB which makes up the majority of the site volume.
Potential reduce by 141.7 kB
HTML content can be minified and compressed by a website’s server. The most efficient way is to compress content using GZIP which reduces data amount travelling through the network between server and browser. HTML code on this page is well minified. It is highly recommended that content of this web page should be compressed using GZIP, as it can save up to 141.7 kB or 82% of the original size.
Potential reduce by 5.5 kB
Image size optimization can help to speed up a website loading time. The chart above shows the difference between the size before and after optimization. Bandwidth images are well optimized though.
Potential reduce by 2.8 kB
It’s better to minify JavaScript in order to improve website performance. The diagram shows the current total size of all JavaScript files against the prospective JavaScript size after its minification and compression. This website has mostly compressed JavaScripts.
Potential reduce by 8.9 kB
CSS files minification is very important to reduce a web page rendering time. The faster CSS files can load, the earlier a page can be rendered. Bandwidth.team has all CSS files already compressed.
Number of requests can be reduced by 57 (84%)
68
11
The browser has sent 68 CSS, Javascripts, AJAX and image requests in order to completely render the main page of Bandwidth. We recommend that multiple CSS and JavaScript files should be merged into one by each type, as it can help reduce assets requests from 32 to 1 for JavaScripts and from 27 to 1 for CSS and as a result speed up the page load time.
bandwidth.team
129 ms
bandwidth.team
2738 ms
js
298 ms
gtm.js
495 ms
wp-emoji-release.min.js
129 ms
style.min.css
319 ms
animate-animo.css
452 ms
styles.css
425 ms
font-awesome.min.css
289 ms
Defaults.css
414 ms
js_composer_front_custom.css
654 ms
pum-site-styles.css
432 ms
css
610 ms
main.min.css
507 ms
icomoon-the7-font.min.css
799 ms
all.min.css
836 ms
back-compat.min.css
816 ms
fontello.min.css
809 ms
post-type.min.css
799 ms
custom.css
1443 ms
media.css
1424 ms
mega-menu.css
1393 ms
the7-elements-albums-portfolio.css
1396 ms
post-type-dynamic.css
1399 ms
style.css
1393 ms
style.min.css
1488 ms
jquery.min.js
1578 ms
jquery-migrate.min.js
1559 ms
above-the-fold.min.js
1546 ms
ultimate-params.min.js
1545 ms
2266.css
1559 ms
1932.css
1560 ms
animate.min.css
1550 ms
css
585 ms
background-style.min.css
1542 ms
main.min.js
1908 ms
animo.min.js
1552 ms
jquery.ba-throttle-debounce.min.js
1553 ms
viewportchecker.js
1554 ms
edsanimate.js
1554 ms
edsanimate.site.js
1531 ms
index.js
1864 ms
api.js
703 ms
index.js
1858 ms
page-scroll-to-id.min.js
1762 ms
analytics.js
642 ms
akismet-frontend.js
1631 ms
js
452 ms
core.min.js
1496 ms
css
410 ms
pum-site-scripts.js
1517 ms
post-type.min.js
1449 ms
wpcf7-recaptcha-controls.js
1428 ms
js_composer_front.min.js
1320 ms
vc-waypoints.min.js
1176 ms
jquery-appear.min.js
1129 ms
ultimate_bg.min.js
1123 ms
custom.min.js
1106 ms
skrollr.min.js
1100 ms
1925.js
1102 ms
collect
1029 ms
logo-2.png
497 ms
webnc-web.png
520 ms
Astra-web.png
492 ms
AvenirLTStd-Book.woff
328 ms
S6uyw4BMUTPHjx4wWA.woff
1197 ms
S6u9w4BMUTPHh6UVSwiPHw.woff
1198 ms
AvenirLTStd-Heavy.woff
323 ms
JTUHjIg1_i6t8kCHKm4532VJOt5-QNFgpCtr6Hw5aXw.woff
1201 ms
JTUHjIg1_i6t8kCHKm4532VJOt5-QNFgpCtr6Xw5aXw.woff
1193 ms
JTUHjIg1_i6t8kCHKm4532VJOt5-QNFgpCu173w5aXw.woff
1231 ms
JTUHjIg1_i6t8kCHKm4532VJOt5-QNFgpCuM73w5aXw.woff
1183 ms
AvenirLTStd-Black.woff
305 ms
pexels-cowomen-2041627-min-scaled.jpg
1166 ms
footerback.jpg
1093 ms
fa-solid-900.woff
975 ms
fa-regular-400.woff
973 ms
fa-brands-400.woff
976 ms
AvenirLTStd-Medium.woff
674 ms
icomoon-the7-font.ttf
673 ms
recaptcha__en.js
443 ms
sss-1.jpg
268 ms
quotes.png
170 ms
logo2.png
170 ms
bandwidth.team accessibility score
Names and labels
These are opportunities to improve the semantics of the controls in your application. This may enhance the experience for users of assistive technology, like a screen reader.
Impact
Issue
Buttons do not have an accessible name
Image elements do not have [alt] attributes
Contrast
These are opportunities to improve the legibility of your content.
Impact
Issue
Background and foreground colors do not have a sufficient contrast ratio.
Tables and lists
These are opportunities to improve the experience of reading tabular or list data using assistive technology, like a screen reader.
Impact
Issue
List items (<li>) are not contained within <ul> or <ol> parent elements.
Best practices
These items highlight common accessibility best practices.
Impact
Issue
[user-scalable="no"] is used in the <meta name="viewport"> element or the [maximum-scale] attribute is less than 5.
bandwidth.team best practices score
Trust and Safety
Impact
Issue
Does not use HTTPS
Ensure CSP is effective against XSS attacks
User Experience
Impact
Issue
Serves images with low resolution
General
Impact
Issue
Detected JavaScript libraries
bandwidth.team SEO score
Crawling and Indexing
To appear in search results, crawlers need access to your app.
Impact
Issue
Links are not crawlable
Content Best Practices
Format your HTML in a way that enables crawlers to better understand your app’s content.
Impact
Issue
Image elements do not have [alt] attributes
Mobile Friendly
Make sure your pages are mobile friendly so users don’t have to pinch or zoom in order to read the content pages. [Learn more](https://developers.google.com/search/mobile-sites/).
Impact
Issue
Document uses legible font sizes
EN
EN
UTF-8
Language claimed in HTML meta tag should match the language actually used on the web page. Otherwise Bandwidth.team can be misinterpreted by Google and other search engines. Our service has detected that English is used on the page, and it matches the claimed language. Our system also found out that Bandwidth.team main page’s claimed encoding is utf-8. Use of this encoding format is the best practice as the main page visitors from all over the world won’t have any issues with symbol transcription.
bandwidth.team
Open Graph data is detected on the main page of Bandwidth. This is the best way to make the web page social media friendly. Here is how it looks like on Facebook: