Report Summary

  • 0

    Performance

  • 0

    Accessibility

  • 0

    Best Practices

  • 0

    SEO

blogdoplotter.com

Blog do Plotter – O blog da Loja do Plotter

Page Load Speed

3.6 sec in total

First Response

238 ms

Resources Loaded

2.6 sec

Page Rendered

694 ms
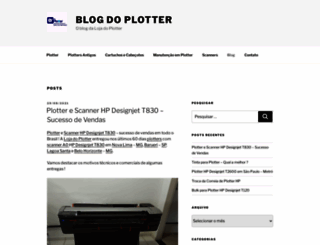
blogdoplotter.com screenshot

About Website

Click here to check amazing Blog Do Plotter content for Brazil. Otherwise, check out these important facts you probably never knew about blogdoplotter.com

Compre Plotter de quem Entende de Plotter! Tire todas as Dúvidas aqui. 17 anos de experiência. Mais de 600 artigos sobre tudo de Plotter

Visit blogdoplotter.com

Key Findings

We analyzed Blogdoplotter.com page load time and found that the first response time was 238 ms and then it took 3.3 sec to load all DOM resources and completely render a web page. This is a poor result, as 55% of websites can load faster.

Performance Metrics

blogdoplotter.com performance score

0

Network Requests Diagram

blogdoplotter.com

238 ms

www.blogdoplotter.com

439 ms

3375562265-css_bundle_v2.css

69 ms

gsearch.css

49 ms

authorization.css

213 ms

Our browser made a total of 111 requests to load all elements on the main page. We found that 3% of them (3 requests) were addressed to the original Blogdoplotter.com, 19% (21 requests) were made to Apis.google.com and 17% (19 requests) were made to Google.com. The less responsive or slowest element that took the longest time to load (607 ms) relates to the external source Googleads.g.doubleclick.net.

Page Optimization Overview & Recommendations

Page size can be reduced by 256.4 kB (36%)

Content Size

709.9 kB

After Optimization

453.5 kB

In fact, the total size of Blogdoplotter.com main page is 709.9 kB. This result falls beyond the top 1M of websites and identifies a large and not optimized web page that may take ages to load. 80% of websites need less resources to load and that’s why Accessify’s recommendations for optimization and resource minification can be helpful for this project. Images take 222.3 kB which makes up the majority of the site volume.

HTML Optimization

-84%

Potential reduce by 135.9 kB

  • Original 162.5 kB
  • After minification 160.9 kB
  • After compression 26.7 kB

HTML content can be minified and compressed by a website’s server. The most efficient way is to compress content using GZIP which reduces data amount travelling through the network between server and browser. HTML code on this page is well minified. It is highly recommended that content of this web page should be compressed using GZIP, as it can save up to 135.9 kB or 84% of the original size.

Image Optimization

-1%

Potential reduce by 1.4 kB

  • Original 222.3 kB
  • After minification 220.8 kB

Image size optimization can help to speed up a website loading time. The chart above shows the difference between the size before and after optimization. Blog Do Plotter images are well optimized though.

JavaScript Optimization

-7%

Potential reduce by 13.0 kB

  • Original 189.5 kB
  • After minification 189.3 kB
  • After compression 176.6 kB

It’s better to minify JavaScript in order to improve website performance. The diagram shows the current total size of all JavaScript files against the prospective JavaScript size after its minification and compression. This website has mostly compressed JavaScripts.

CSS Optimization

-78%

Potential reduce by 106.1 kB

  • Original 135.5 kB
  • After minification 119.5 kB
  • After compression 29.4 kB

CSS files minification is very important to reduce a web page rendering time. The faster CSS files can load, the earlier a page can be rendered. Blogdoplotter.com needs all CSS files to be minified and compressed as it can save up to 106.1 kB or 78% of the original size.

Requests Breakdown

Number of requests can be reduced by 58 (56%)

Requests Now

104

After Optimization

46

The browser has sent 104 CSS, Javascripts, AJAX and image requests in order to completely render the main page of Blog Do Plotter. We recommend that multiple CSS and JavaScript files should be merged into one by each type, as it can help reduce assets requests from 34 to 1 for JavaScripts and from 9 to 1 for CSS and as a result speed up the page load time.

SEO Factors

blogdoplotter.com SEO score

0

Language and Encoding

  • Language Detected

    PT

  • Language Claimed

    N/A

  • Encoding

    UTF-8

Language claimed in HTML meta tag should match the language actually used on the web page. Otherwise Blogdoplotter.com can be misinterpreted by Google and other search engines. Our service has detected that Portuguese is used on the page, and neither this language nor any other was claimed in <html> or <meta> tags. Our system also found out that Blogdoplotter.com main page’s claimed encoding is utf-8. Use of this encoding format is the best practice as the main page visitors from all over the world won’t have any issues with symbol transcription.

Social Sharing Optimization

Open Graph description is not detected on the main page of Blog Do Plotter. Lack of Open Graph description can be counter-productive for their social media presence, as such a description allows converting a website homepage (or other pages) into good-looking, rich and well-structured posts, when it is being shared on Facebook and other social media. For example, adding the following code snippet into HTML <head> tag will help to represent this web page correctly in social networks: