Report Summary

  • 23

    Performance

    Renders faster than
    42% of other websites

  • 94

    Accessibility

    Visual factors better than
    that of 84% of websites

  • 83

    Best Practices

    More advanced features
    available than in
    56% of websites

  • 86

    SEO

    Google-friendlier than
    60% of websites

es.burberry.com

Burberry | Sitio web oficial y tienda

Page Load Speed

1.2 sec in total

First Response

178 ms

Resources Loaded

781 ms

Page Rendered

222 ms
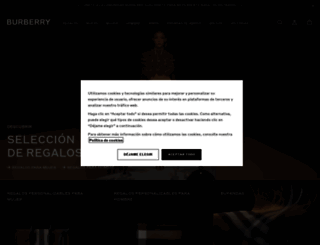
es.burberry.com screenshot

About Website

Click here to check amazing Es Burberry content for Japan. Otherwise, check out these important facts you probably never knew about es.burberry.com

Descubre prendas británicas de lujo, bolsos, accesorios y fragancias para hombre y mujer. Envío gratuito disponible.

Visit es.burberry.com

Key Findings

We analyzed Es.burberry.com page load time and found that the first response time was 178 ms and then it took 1 sec to load all DOM resources and completely render a web page. This is quite a good result, as only 20% of websites can load faster. This domain responded with an error, which can significantly jeopardize Es.burberry.com rating and web reputation

Performance Metrics

es.burberry.com performance score

23

Measured Metrics

name

value

score

weighting

FCP (First Contentful Paint)

Value2.0 s

83/100

10%

LCP (Largest Contentful Paint)

Value26.8 s

0/100

25%

SI (Speed Index)

Value33.3 s

0/100

10%

TBT (Total Blocking Time)

Value38,750 ms

0/100

30%

CLS (Cumulative Layout Shift)

Value0.003

100/100

15%

TTI (Time to Interactive)

Value55.5 s

0/100

10%

Network Requests Diagram

es.burberry.com

178 ms

mmcore.js

31 ms

cssCombined_site_0245ce2901a1da7551d41a1bfa73da5d0dfe3854.css

168 ms

cssCombined_landing_grid_2_0245ce2901a1da7551d41a1bfa73da5d0dfe3854.css

57 ms

jsCombined_min_header_0245ce2901a1da7551d41a1bfa73da5d0dfe3854.js

130 ms

Our browser made a total of 28 requests to load all elements on the main page. We found that 54% of them (15 requests) were addressed to the original Es.burberry.com, 18% (5 requests) were made to S.btstatic.com and 7% (2 requests) were made to Service.maxymiser.net. The less responsive or slowest element that took the longest time to load (316 ms) relates to the external source La1c1.salesforceliveagent.com.

Page Optimization Overview & Recommendations

Page size can be reduced by 624.8 kB (71%)

Content Size

874.2 kB

After Optimization

249.5 kB

In fact, the total size of Es.burberry.com main page is 874.2 kB. This result falls beyond the top 1M of websites and identifies a large and not optimized web page that may take ages to load. 25% of websites need less resources to load. Javascripts take 493.7 kB which makes up the majority of the site volume.

HTML Optimization

-75%

Potential reduce by 42.4 kB

  • Original 56.2 kB
  • After minification 51.6 kB
  • After compression 13.8 kB

HTML content can be minified and compressed by a website’s server. The most efficient way is to compress content using GZIP which reduces data amount travelling through the network between server and browser. HTML code on this page is well minified. It is highly recommended that content of this web page should be compressed using GZIP, as it can save up to 42.4 kB or 75% of the original size.

Image Optimization

-13%

Potential reduce by 8.3 kB

  • Original 62.1 kB
  • After minification 53.8 kB

Image size optimization can help to speed up a website loading time. The chart above shows the difference between the size before and after optimization. Obviously, Es Burberry needs image optimization as it can save up to 8.3 kB or 13% of the original volume. The most popular and efficient tools for JPEG and PNG image optimization are Jpegoptim and PNG Crush.

JavaScript Optimization

-70%

Potential reduce by 347.3 kB

  • Original 493.7 kB
  • After minification 492.8 kB
  • After compression 146.4 kB

It’s better to minify JavaScript in order to improve website performance. The diagram shows the current total size of all JavaScript files against the prospective JavaScript size after its minification and compression. It is highly recommended that all JavaScript files should be compressed and minified as it can save up to 347.3 kB or 70% of the original size.

CSS Optimization

-87%

Potential reduce by 226.8 kB

  • Original 262.2 kB
  • After minification 220.8 kB
  • After compression 35.4 kB

CSS files minification is very important to reduce a web page rendering time. The faster CSS files can load, the earlier a page can be rendered. Es.burberry.com needs all CSS files to be minified and compressed as it can save up to 226.8 kB or 87% of the original size.

Requests Breakdown

Number of requests can be reduced by 12 (50%)

Requests Now

24

After Optimization

12

The browser has sent 24 CSS, Javascripts, AJAX and image requests in order to completely render the main page of Es Burberry. We recommend that multiple CSS and JavaScript files should be merged into one by each type, as it can help reduce assets requests from 13 to 1 for JavaScripts and as a result speed up the page load time.

Accessibility Review

es.burberry.com accessibility score

94

Accessibility Issues

ARIA

These are opportunities to improve the usage of ARIA in your application which may enhance the experience for users of assistive technology, like a screen reader.

Impact

Issue

High

[aria-*] attributes do not match their roles

Best Practices

es.burberry.com best practices score

83

Areas of Improvement

Trust and Safety

Impact

Issue

High

Does not use HTTPS

Low

Ensure CSP is effective against XSS attacks

General

Impact

Issue

Low

Detected JavaScript libraries

High

Browser errors were logged to the console

High

Missing source maps for large first-party JavaScript

SEO Factors

es.burberry.com SEO score

86

Search Engine Optimization Advices

Content Best Practices

Format your HTML in a way that enables crawlers to better understand your app’s content.

Impact

Issue

High

Links do not have descriptive text

Crawling and Indexing

To appear in search results, crawlers need access to your app.

Impact

Issue

High

Links are not crawlable

Mobile Friendly

Make sure your pages are mobile friendly so users don’t have to pinch or zoom in order to read the content pages. [Learn more](https://developers.google.com/search/mobile-sites/).

Impact

Issue

High

Document uses legible font sizes

Language and Encoding

  • Language Detected

    ES

  • Language Claimed

    ES

  • Encoding

    UTF-8

Language claimed in HTML meta tag should match the language actually used on the web page. Otherwise Es.burberry.com can be misinterpreted by Google and other search engines. Our service has detected that Spanish is used on the page, and it matches the claimed language. Our system also found out that Es.burberry.com main page’s claimed encoding is utf-8. Use of this encoding format is the best practice as the main page visitors from all over the world won’t have any issues with symbol transcription.

Social Sharing Optimization

Open Graph description is not detected on the main page of Es Burberry. Lack of Open Graph description can be counter-productive for their social media presence, as such a description allows converting a website homepage (or other pages) into good-looking, rich and well-structured posts, when it is being shared on Facebook and other social media. For example, adding the following code snippet into HTML <head> tag will help to represent this web page correctly in social networks: