Report Summary

  • 79

    Performance

    Renders faster than
    86% of other websites

  • 80

    Accessibility

    Visual factors better than
    that of 50% of websites

  • 67

    Best Practices

    More advanced features
    available than in
    24% of websites

  • 88

    SEO

    Google-friendlier than
    66% of websites

cidago.com

isimtescil.net | Türkiye'nin Domain ve Hosting Lideri | Hoş geldiniz

Page Load Speed

2.7 sec in total

First Response

396 ms

Resources Loaded

1.9 sec

Page Rendered

440 ms
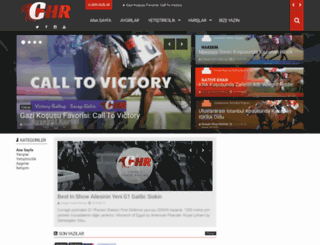
cidago.com screenshot

About Website

Click here to check amazing Cidago content. Otherwise, check out these important facts you probably never knew about cidago.com

Domain ve Hosting'in Türkiye'deki bir numaralı ismi İsimtecil, markanızın dijitaldeki tüm sorumluluğunu üstleniyor, markanıza dijital görünürlük sağlıyor. Siz de Domain ve Hosting paketlerinden özel o...

Visit cidago.com

Key Findings

We analyzed Cidago.com page load time and found that the first response time was 396 ms and then it took 2.3 sec to load all DOM resources and completely render a web page. This is quite a good result, as only 45% of websites can load faster.

Performance Metrics

cidago.com performance score

79

Measured Metrics

name

value

score

weighting

FCP (First Contentful Paint)

Value1.9 s

86/100

10%

LCP (Largest Contentful Paint)

Value3.0 s

78/100

25%

SI (Speed Index)

Value5.1 s

61/100

10%

TBT (Total Blocking Time)

Value240 ms

85/100

30%

CLS (Cumulative Layout Shift)

Value0.189

65/100

15%

TTI (Time to Interactive)

Value3.4 s

93/100

10%

Network Requests Diagram

cidago.com

396 ms

www.cidago.com

347 ms

font-awesome.min.css

5 ms

3375562265-css_bundle_v2.css

94 ms

authorization.css

150 ms

Our browser made a total of 55 requests to load all elements on the main page. We found that 15% of them (8 requests) were addressed to the original Cidago.com, 18% (10 requests) were made to 1.bp.blogspot.com and 16% (9 requests) were made to 3.bp.blogspot.com. The less responsive or slowest element that took the longest time to load (742 ms) relates to the external source 4.bp.blogspot.com.

Page Optimization Overview & Recommendations

Page size can be reduced by 474.8 kB (15%)

Content Size

3.3 MB

After Optimization

2.8 MB

In fact, the total size of Cidago.com main page is 3.3 MB. This result falls beyond the top 1M of websites and identifies a large and not optimized web page that may take ages to load. 75% of websites need less resources to load and that’s why Accessify’s recommendations for optimization and resource minification can be helpful for this project. Images take 2.7 MB which makes up the majority of the site volume.

HTML Optimization

-79%

Potential reduce by 340.8 kB

  • Original 429.9 kB
  • After minification 428.9 kB
  • After compression 89.1 kB

HTML content can be minified and compressed by a website’s server. The most efficient way is to compress content using GZIP which reduces data amount travelling through the network between server and browser. HTML code on this page is well minified. It is highly recommended that content of this web page should be compressed using GZIP, as it can save up to 340.8 kB or 79% of the original size.

Image Optimization

-3%

Potential reduce by 83.6 kB

  • Original 2.7 MB
  • After minification 2.6 MB

Image size optimization can help to speed up a website loading time. The chart above shows the difference between the size before and after optimization. Cidago images are well optimized though.

JavaScript Optimization

-27%

Potential reduce by 32.1 kB

  • Original 120.3 kB
  • After minification 120.3 kB
  • After compression 88.2 kB

It’s better to minify JavaScript in order to improve website performance. The diagram shows the current total size of all JavaScript files against the prospective JavaScript size after its minification and compression. It is highly recommended that all JavaScript files should be compressed and minified as it can save up to 32.1 kB or 27% of the original size.

CSS Optimization

-58%

Potential reduce by 18.3 kB

  • Original 31.8 kB
  • After minification 31.8 kB
  • After compression 13.5 kB

CSS files minification is very important to reduce a web page rendering time. The faster CSS files can load, the earlier a page can be rendered. Cidago.com needs all CSS files to be minified and compressed as it can save up to 18.3 kB or 58% of the original size.

Requests Breakdown

Number of requests can be reduced by 7 (13%)

Requests Now

52

After Optimization

45

The browser has sent 52 CSS, Javascripts, AJAX and image requests in order to completely render the main page of Cidago. We recommend that multiple CSS and JavaScript files should be merged into one by each type, as it can help reduce assets requests from 8 to 1 for JavaScripts and as a result speed up the page load time.

Accessibility Review

cidago.com accessibility score

80

Accessibility Issues

Names and labels

These are opportunities to improve the semantics of the controls in your application. This may enhance the experience for users of assistive technology, like a screen reader.

Impact

Issue

High

Buttons do not have an accessible name

Contrast

These are opportunities to improve the legibility of your content.

Impact

Issue

High

Background and foreground colors do not have a sufficient contrast ratio.

Best practices

These items highlight common accessibility best practices.

Impact

Issue

High

[user-scalable="no"] is used in the <meta name="viewport"> element or the [maximum-scale] attribute is less than 5.

Best Practices

cidago.com best practices score

67

Areas of Improvement

Trust and Safety

Impact

Issue

High

Does not use HTTPS

High

Includes front-end JavaScript libraries with known security vulnerabilities

Low

Ensure CSP is effective against XSS attacks

User Experience

Impact

Issue

High

Serves images with low resolution

General

Impact

Issue

Low

Detected JavaScript libraries

High

Browser errors were logged to the console

High

Page has valid source maps

SEO Factors

cidago.com SEO score

88

Search Engine Optimization Advices

Crawling and Indexing

To appear in search results, crawlers need access to your app.

Impact

Issue

High

Links are not crawlable

Mobile Friendly

Make sure your pages are mobile friendly so users don’t have to pinch or zoom in order to read the content pages. [Learn more](https://developers.google.com/search/mobile-sites/).

Impact

Issue

High

Document uses legible font sizes

High

Tap targets are not sized appropriately

Language and Encoding

  • Language Detected

    TR

  • Language Claimed

    N/A

  • Encoding

    UTF-8

Language claimed in HTML meta tag should match the language actually used on the web page. Otherwise Cidago.com can be misinterpreted by Google and other search engines. Our service has detected that Turkish is used on the page, and neither this language nor any other was claimed in <html> or <meta> tags. Our system also found out that Cidago.com main page’s claimed encoding is utf-8. Use of this encoding format is the best practice as the main page visitors from all over the world won’t have any issues with symbol transcription.

Social Sharing Optimization

Open Graph data is detected on the main page of Cidago. This is the best way to make the web page social media friendly. Here is how it looks like on Facebook: