Report Summary

  • 63

    Performance

    Renders faster than
    77% of other websites

  • 53

    Accessibility

    Visual factors better than
    that of 22% of websites

  • 67

    Best Practices

    More advanced features
    available than in
    24% of websites

  • 62

    SEO

    Google-friendlier than
    22% of websites

claims-portal.com

Insurance Claims Adjuster - Claims-Portal.com

Page Load Speed

2.1 sec in total

First Response

673 ms

Resources Loaded

1.2 sec

Page Rendered

211 ms
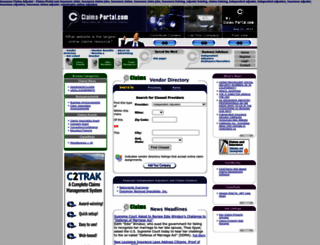
claims-portal.com screenshot

About Website

Visit claims-portal.com now to see the best up-to-date Claims Portal content for United States and also check out these interesting facts you probably never knew about claims-portal.com

Insurance Claims Adjuster - Claims-Portal.com Property and casualty insurance claim adjuster resources: insurance claims jobs, news, and resources for insurance claim adjusters, independent adjusters,...

Visit claims-portal.com

Key Findings

We analyzed Claims-portal.com page load time and found that the first response time was 673 ms and then it took 1.4 sec to load all DOM resources and completely render a web page. This is quite a good result, as only 25% of websites can load faster. This domain responded with an error, which can significantly jeopardize Claims-portal.com rating and web reputation

Performance Metrics

claims-portal.com performance score

63

Measured Metrics

name

value

score

weighting

FCP (First Contentful Paint)

Value2.7 s

60/100

10%

LCP (Largest Contentful Paint)

Value5.7 s

16/100

25%

SI (Speed Index)

Value2.7 s

96/100

10%

TBT (Total Blocking Time)

Value270 ms

81/100

30%

CLS (Cumulative Layout Shift)

Value0.134

80/100

15%

TTI (Time to Interactive)

Value5.3 s

73/100

10%

Network Requests Diagram

claims-portal.com

673 ms

AC_RunActiveContent.js

165 ms

__utm.js

164 ms

addthis_widget.js

10 ms

urchin.js

101 ms

Our browser made a total of 73 requests to load all elements on the main page. We found that 74% of them (54 requests) were addressed to the original Claims-portal.com, 11% (8 requests) were made to Apis.google.com and 5% (4 requests) were made to Google-analytics.com. The less responsive or slowest element that took the longest time to load (673 ms) belongs to the original domain Claims-portal.com.

Page Optimization Overview & Recommendations

Page size can be reduced by 379.1 kB (56%)

Content Size

678.0 kB

After Optimization

298.8 kB

In fact, the total size of Claims-portal.com main page is 678.0 kB. This result falls beyond the top 1M of websites and identifies a large and not optimized web page that may take ages to load. 45% of websites need less resources to load. Javascripts take 466.4 kB which makes up the majority of the site volume.

HTML Optimization

-78%

Potential reduce by 92.5 kB

  • Original 118.9 kB
  • After minification 108.0 kB
  • After compression 26.4 kB

HTML content can be minified and compressed by a website’s server. The most efficient way is to compress content using GZIP which reduces data amount travelling through the network between server and browser. HTML code on this page is well minified. It is highly recommended that content of this web page should be compressed using GZIP, as it can save up to 92.5 kB or 78% of the original size.

Image Optimization

-0%

Potential reduce by 398 B

  • Original 92.7 kB
  • After minification 92.3 kB

Image size optimization can help to speed up a website loading time. The chart above shows the difference between the size before and after optimization. Claims Portal images are well optimized though.

JavaScript Optimization

-61%

Potential reduce by 286.3 kB

  • Original 466.4 kB
  • After minification 465.4 kB
  • After compression 180.1 kB

It’s better to minify JavaScript in order to improve website performance. The diagram shows the current total size of all JavaScript files against the prospective JavaScript size after its minification and compression. It is highly recommended that all JavaScript files should be compressed and minified as it can save up to 286.3 kB or 61% of the original size.

Requests Breakdown

Number of requests can be reduced by 40 (56%)

Requests Now

71

After Optimization

31

The browser has sent 71 CSS, Javascripts, AJAX and image requests in order to completely render the main page of Claims Portal. We recommend that multiple CSS and JavaScript files should be merged into one by each type, as it can help reduce assets requests from 14 to 1 for JavaScripts and as a result speed up the page load time.

Accessibility Review

claims-portal.com accessibility score

53

Accessibility Issues

Names and labels

These are opportunities to improve the semantics of the controls in your application. This may enhance the experience for users of assistive technology, like a screen reader.

Impact

Issue

High

<frame> or <iframe> elements do not have a title

High

Image elements do not have [alt] attributes

High

Form elements do not have associated labels

High

Links do not have a discernible name

Internationalization and localization

These are opportunities to improve the interpretation of your content by users in different locales.

Impact

Issue

High

<html> element does not have a [lang] attribute

Tables and lists

These are opportunities to improve the experience of reading tabular or list data using assistive technology, like a screen reader.

Impact

Issue

High

List items (<li>) are not contained within <ul> or <ol> parent elements.

Best Practices

claims-portal.com best practices score

67

Areas of Improvement

Trust and Safety

Impact

Issue

High

Does not use HTTPS

Low

Ensure CSP is effective against XSS attacks

User Experience

Impact

Issue

High

Serves images with low resolution

General

Impact

Issue

High

Browser errors were logged to the console

SEO Factors

claims-portal.com SEO score

62

Search Engine Optimization Advices

Crawling and Indexing

To appear in search results, crawlers need access to your app.

Impact

Issue

High

Links are not crawlable

Content Best Practices

Format your HTML in a way that enables crawlers to better understand your app’s content.

Impact

Issue

High

Image elements do not have [alt] attributes

Language and Encoding

  • Language Detected

    N/A

  • Language Claimed

    N/A

  • Encoding

    ISO-8859-1

Language claimed in HTML meta tag should match the language actually used on the web page. Otherwise Claims-portal.com can be misinterpreted by Google and other search engines. Unfortunately we cannot identify language used on the page (probably there is a mix of languages, too little text or something else) and no language is claimed in <html> or <meta> tags either. Our system also found out that Claims-portal.com main page’s claimed encoding is iso-8859-1. Changing it to UTF-8 can be a good choice, as this format is commonly used for encoding all over the web and thus their visitors won’t have any troubles with symbol transcription or reading.

Social Sharing Optimization

Open Graph description is not detected on the main page of Claims Portal. Lack of Open Graph description can be counter-productive for their social media presence, as such a description allows converting a website homepage (or other pages) into good-looking, rich and well-structured posts, when it is being shared on Facebook and other social media. For example, adding the following code snippet into HTML <head> tag will help to represent this web page correctly in social networks: