Report Summary

  • 75

    Performance

    Renders faster than
    84% of other websites

  • 86

    Accessibility

    Visual factors better than
    that of 62% of websites

  • 83

    Best Practices

    More advanced features
    available than in
    56% of websites

  • 89

    SEO

    Google-friendlier than
    67% of websites

diglog.com

diglog 奇客发现

Page Load Speed

15.6 sec in total

First Response

1.2 sec

Resources Loaded

13.8 sec

Page Rendered

635 ms
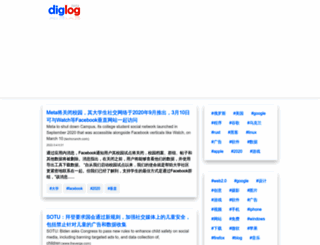
diglog.com screenshot

About Website

Welcome to diglog.com homepage info - get ready to check Diglog best content for China right away, or after learning these important things about diglog.com

收集网络上最新鲜有趣的内容,让你感觉到值得分享给朋友。

Visit diglog.com

Key Findings

We analyzed Diglog.com page load time and found that the first response time was 1.2 sec and then it took 14.4 sec to load all DOM resources and completely render a web page. This is a poor result, as 90% of websites can load faster.

Performance Metrics

diglog.com performance score

75

Measured Metrics

name

value

score

weighting

FCP (First Contentful Paint)

Value2.3 s

73/100

10%

LCP (Largest Contentful Paint)

Value2.7 s

86/100

25%

SI (Speed Index)

Value3.0 s

94/100

10%

TBT (Total Blocking Time)

Value500 ms

58/100

30%

CLS (Cumulative Layout Shift)

Value0.061

97/100

15%

TTI (Time to Interactive)

Value7.2 s

51/100

10%

Network Requests Diagram

diglog.com

1191 ms

www.diglog.com

5456 ms

pure-min.css

1784 ms

css.css

1394 ms

jquery-1.4.2.min.js

4266 ms

Our browser made a total of 67 requests to load all elements on the main page. We found that 3% of them (2 requests) were addressed to the original Diglog.com, 49% (33 requests) were made to Img.diglog.com and 15% (10 requests) were made to Cpro.baidustatic.com. The less responsive or slowest element that took the longest time to load (5.7 sec) relates to the external source Img.diglog.com.

Page Optimization Overview & Recommendations

Page size can be reduced by 543.7 kB (46%)

Content Size

1.2 MB

After Optimization

637.6 kB

In fact, the total size of Diglog.com main page is 1.2 MB. This result falls beyond the top 1M of websites and identifies a large and not optimized web page that may take ages to load. 35% of websites need less resources to load. Javascripts take 550.1 kB which makes up the majority of the site volume.

HTML Optimization

-74%

Potential reduce by 43.5 kB

  • Original 58.6 kB
  • After minification 58.5 kB
  • After compression 15.1 kB

HTML content can be minified and compressed by a website’s server. The most efficient way is to compress content using GZIP which reduces data amount travelling through the network between server and browser. HTML code on this page is well minified. It is highly recommended that content of this web page should be compressed using GZIP, as it can save up to 43.5 kB or 74% of the original size.

Image Optimization

-16%

Potential reduce by 82.6 kB

  • Original 512.6 kB
  • After minification 430.0 kB

Image size optimization can help to speed up a website loading time. The chart above shows the difference between the size before and after optimization. Obviously, Diglog needs image optimization as it can save up to 82.6 kB or 16% of the original volume. The most popular and efficient tools for JPEG and PNG image optimization are Jpegoptim and PNG Crush.

JavaScript Optimization

-67%

Potential reduce by 368.7 kB

  • Original 550.1 kB
  • After minification 549.4 kB
  • After compression 181.4 kB

It’s better to minify JavaScript in order to improve website performance. The diagram shows the current total size of all JavaScript files against the prospective JavaScript size after its minification and compression. It is highly recommended that all JavaScript files should be compressed and minified as it can save up to 368.7 kB or 67% of the original size.

CSS Optimization

-82%

Potential reduce by 48.8 kB

  • Original 59.9 kB
  • After minification 54.5 kB
  • After compression 11.1 kB

CSS files minification is very important to reduce a web page rendering time. The faster CSS files can load, the earlier a page can be rendered. Diglog.com needs all CSS files to be minified and compressed as it can save up to 48.8 kB or 82% of the original size.

Requests Breakdown

Number of requests can be reduced by 21 (32%)

Requests Now

65

After Optimization

44

The browser has sent 65 CSS, Javascripts, AJAX and image requests in order to completely render the main page of Diglog. We recommend that multiple CSS and JavaScript files should be merged into one by each type, as it can help reduce assets requests from 16 to 1 for JavaScripts and as a result speed up the page load time.

Accessibility Review

diglog.com accessibility score

86

Accessibility Issues

ARIA

These are opportunities to improve the usage of ARIA in your application which may enhance the experience for users of assistive technology, like a screen reader.

Impact

Issue

High

[aria-*] attributes do not match their roles

Contrast

These are opportunities to improve the legibility of your content.

Impact

Issue

High

Background and foreground colors do not have a sufficient contrast ratio.

Names and labels

These are opportunities to improve the semantics of the controls in your application. This may enhance the experience for users of assistive technology, like a screen reader.

Impact

Issue

High

<frame> or <iframe> elements do not have a title

Best Practices

diglog.com best practices score

83

Areas of Improvement

Trust and Safety

Impact

Issue

High

Does not use HTTPS

Low

Ensure CSP is effective against XSS attacks

User Experience

Impact

Issue

High

Serves images with low resolution

SEO Factors

diglog.com SEO score

89

Search Engine Optimization Advices

Mobile Friendly

Make sure your pages are mobile friendly so users don’t have to pinch or zoom in order to read the content pages. [Learn more](https://developers.google.com/search/mobile-sites/).

Impact

Issue

High

Document uses legible font sizes

High

Tap targets are not sized appropriately

Language and Encoding

  • Language Detected

    ZH

  • Language Claimed

    ZH

  • Encoding

    UTF-8

Language claimed in HTML meta tag should match the language actually used on the web page. Otherwise Diglog.com can be misinterpreted by Google and other search engines. Our service has detected that Chinese is used on the page, and it matches the claimed language. Our system also found out that Diglog.com main page’s claimed encoding is utf-8. Use of this encoding format is the best practice as the main page visitors from all over the world won’t have any issues with symbol transcription.

Social Sharing Optimization

Open Graph description is not detected on the main page of Diglog. Lack of Open Graph description can be counter-productive for their social media presence, as such a description allows converting a website homepage (or other pages) into good-looking, rich and well-structured posts, when it is being shared on Facebook and other social media. For example, adding the following code snippet into HTML <head> tag will help to represent this web page correctly in social networks: