Report Summary

  • 0

    Performance

  • 0

    Accessibility

  • 0

    Best Practices

  • 0

    SEO

disaster.net

Log into Facebook

Page Load Speed

3.6 sec in total

First Response

178 ms

Resources Loaded

3.2 sec

Page Rendered

211 ms
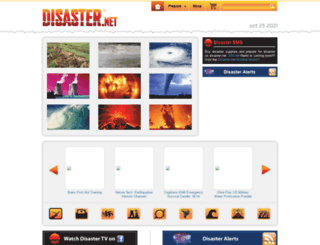
disaster.net screenshot

About Website

Click here to check amazing Disaster content. Otherwise, check out these important facts you probably never knew about disaster.net

Log into Facebook to start sharing and connecting with your friends, family, and people you know.

Visit disaster.net

Key Findings

We analyzed Disaster.net page load time and found that the first response time was 178 ms and then it took 3.4 sec to load all DOM resources and completely render a web page. This is a poor result, as 60% of websites can load faster.

Performance Metrics

disaster.net performance score

0

Network Requests Diagram

disaster.net

178 ms

www.disaster.net

1116 ms

analytics.js

4 ms

b=css&f=site.css&v=1.1

302 ms

modernizr-1.6.min.js

65 ms

Our browser made a total of 135 requests to load all elements on the main page. We found that 44% of them (59 requests) were addressed to the original Disaster.net, 24% (33 requests) were made to Static.xx.fbcdn.net and 11% (15 requests) were made to Scontent-iad3-1.xx.fbcdn.net. The less responsive or slowest element that took the longest time to load (1.1 sec) belongs to the original domain Disaster.net.

Page Optimization Overview & Recommendations

Page size can be reduced by 159.5 kB (21%)

Content Size

774.8 kB

After Optimization

615.3 kB

In fact, the total size of Disaster.net main page is 774.8 kB. This result falls beyond the top 1M of websites and identifies a large and not optimized web page that may take ages to load. 75% of websites need less resources to load and that’s why Accessify’s recommendations for optimization and resource minification can be helpful for this project. Images take 546.4 kB which makes up the majority of the site volume.

HTML Optimization

-76%

Potential reduce by 21.8 kB

  • Original 28.7 kB
  • After minification 27.8 kB
  • After compression 7.0 kB

HTML content can be minified and compressed by a website’s server. The most efficient way is to compress content using GZIP which reduces data amount travelling through the network between server and browser. HTML code on this page is well minified. It is highly recommended that content of this web page should be compressed using GZIP, as it can save up to 21.8 kB or 76% of the original size.

Image Optimization

-4%

Potential reduce by 21.9 kB

  • Original 546.4 kB
  • After minification 524.6 kB

Image size optimization can help to speed up a website loading time. The chart above shows the difference between the size before and after optimization. Disaster images are well optimized though.

JavaScript Optimization

-58%

Potential reduce by 115.9 kB

  • Original 199.7 kB
  • After minification 199.5 kB
  • After compression 83.8 kB

It’s better to minify JavaScript in order to improve website performance. The diagram shows the current total size of all JavaScript files against the prospective JavaScript size after its minification and compression. It is highly recommended that all JavaScript files should be compressed and minified as it can save up to 115.9 kB or 58% of the original size.

Requests Breakdown

Number of requests can be reduced by 47 (36%)

Requests Now

130

After Optimization

83

The browser has sent 130 CSS, Javascripts, AJAX and image requests in order to completely render the main page of Disaster. We recommend that multiple CSS and JavaScript files should be merged into one by each type, as it can help reduce assets requests from 29 to 1 for JavaScripts and from 8 to 1 for CSS and as a result speed up the page load time.

SEO Factors

disaster.net SEO score

0

Language and Encoding

  • Language Detected

    EN

  • Language Claimed

    EN

  • Encoding

    UTF-8

Language claimed in HTML meta tag should match the language actually used on the web page. Otherwise Disaster.net can be misinterpreted by Google and other search engines. Our service has detected that English is used on the page, and it matches the claimed language. Our system also found out that Disaster.net main page’s claimed encoding is utf-8. Use of this encoding format is the best practice as the main page visitors from all over the world won’t have any issues with symbol transcription.

Social Sharing Optimization

Open Graph description is not detected on the main page of Disaster. Lack of Open Graph description can be counter-productive for their social media presence, as such a description allows converting a website homepage (or other pages) into good-looking, rich and well-structured posts, when it is being shared on Facebook and other social media. For example, adding the following code snippet into HTML <head> tag will help to represent this web page correctly in social networks: