Report Summary

  • 93

    Performance

    Renders faster than
    92% of other websites

  • 69

    Accessibility

    Visual factors better than
    that of 35% of websites

  • 58

    Best Practices

    More advanced features
    available than in
    19% of websites

  • 93

    SEO

    Google-friendlier than
    84% of websites

conference.e840.net

無料相談窓口|e840.net栄養士による衛生・栄養健康相談窓口

Page Load Speed

10.3 sec in total

First Response

1.1 sec

Resources Loaded

9 sec

Page Rendered

186 ms
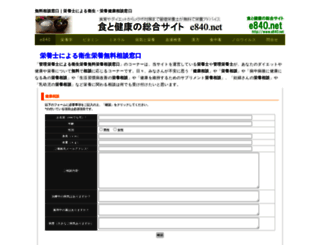
conference.e840.net screenshot

About Website

Welcome to conference.e840.net homepage info - get ready to check Conference E 840 best content for Japan right away, or after learning these important things about conference.e840.net

e840.net栄養士、管理栄養士による無料衛生栄養相談を受け付けています。

Visit conference.e840.net

Key Findings

We analyzed Conference.e840.net page load time and found that the first response time was 1.1 sec and then it took 9.2 sec to load all DOM resources and completely render a web page. This is a poor result, as 85% of websites can load faster.

Performance Metrics

conference.e840.net performance score

93

Measured Metrics

name

value

score

weighting

FCP (First Contentful Paint)

Value2.0 s

84/100

10%

LCP (Largest Contentful Paint)

Value2.8 s

82/100

25%

SI (Speed Index)

Value3.2 s

92/100

10%

TBT (Total Blocking Time)

Value10 ms

100/100

30%

CLS (Cumulative Layout Shift)

Value0

100/100

15%

TTI (Time to Interactive)

Value3.2 s

94/100

10%

Network Requests Diagram

conference.e840.net

1078 ms

common.css

509 ms

jquery.js

2193 ms

analytics.js

17 ms

e840topimage1.jpg

183 ms

Our browser made a total of 29 requests to load all elements on the main page. We found that 62% of them (18 requests) were addressed to the original Conference.e840.net, 7% (2 requests) were made to Google-analytics.com and 7% (2 requests) were made to E840.xsrv.jp. The less responsive or slowest element that took the longest time to load (5.9 sec) belongs to the original domain Conference.e840.net.

Page Optimization Overview & Recommendations

Page size can be reduced by 112.6 kB (26%)

Content Size

438.7 kB

After Optimization

326.1 kB

In fact, the total size of Conference.e840.net main page is 438.7 kB. This result falls beyond the top 1M of websites and identifies a large and not optimized web page that may take ages to load. 20% of websites need less resources to load. Images take 275.0 kB which makes up the majority of the site volume.

HTML Optimization

-70%

Potential reduce by 7.3 kB

  • Original 10.4 kB
  • After minification 9.8 kB
  • After compression 3.1 kB

HTML content can be minified and compressed by a website’s server. The most efficient way is to compress content using GZIP which reduces data amount travelling through the network between server and browser. HTML code on this page is well minified. It is highly recommended that content of this web page should be compressed using GZIP, as it can save up to 7.3 kB or 70% of the original size.

Image Optimization

-3%

Potential reduce by 6.9 kB

  • Original 275.0 kB
  • After minification 268.1 kB

Image size optimization can help to speed up a website loading time. The chart above shows the difference between the size before and after optimization. Conference E 840 images are well optimized though.

JavaScript Optimization

-63%

Potential reduce by 91.4 kB

  • Original 144.5 kB
  • After minification 144.5 kB
  • After compression 53.2 kB

It’s better to minify JavaScript in order to improve website performance. The diagram shows the current total size of all JavaScript files against the prospective JavaScript size after its minification and compression. It is highly recommended that all JavaScript files should be compressed and minified as it can save up to 91.4 kB or 63% of the original size.

CSS Optimization

-80%

Potential reduce by 7.0 kB

  • Original 8.8 kB
  • After minification 5.9 kB
  • After compression 1.7 kB

CSS files minification is very important to reduce a web page rendering time. The faster CSS files can load, the earlier a page can be rendered. Conference.e840.net needs all CSS files to be minified and compressed as it can save up to 7.0 kB or 80% of the original size.

Requests Breakdown

We found no issues to fix!

Requests Now

26

After Optimization

26

The browser has sent 26 CSS, Javascripts, AJAX and image requests in order to completely render the main page of Conference E 840. According to our analytics all requests are already optimized.

Accessibility Review

conference.e840.net accessibility score

69

Accessibility Issues

Contrast

These are opportunities to improve the legibility of your content.

Impact

Issue

High

Background and foreground colors do not have a sufficient contrast ratio.

Names and labels

These are opportunities to improve the semantics of the controls in your application. This may enhance the experience for users of assistive technology, like a screen reader.

Impact

Issue

High

<frame> or <iframe> elements do not have a title

High

Image elements do not have [alt] attributes

High

Links do not have a discernible name

Best Practices

conference.e840.net best practices score

58

Areas of Improvement

Trust and Safety

Impact

Issue

High

Does not use HTTPS

High

Includes front-end JavaScript libraries with known security vulnerabilities

Low

Ensure CSP is effective against XSS attacks

User Experience

Impact

Issue

High

Serves images with low resolution

General

Impact

Issue

Low

Detected JavaScript libraries

High

Browser errors were logged to the console

SEO Factors

conference.e840.net SEO score

93

Search Engine Optimization Advices

Content Best Practices

Format your HTML in a way that enables crawlers to better understand your app’s content.

Impact

Issue

High

Image elements do not have [alt] attributes

Mobile Friendly

Make sure your pages are mobile friendly so users don’t have to pinch or zoom in order to read the content pages. [Learn more](https://developers.google.com/search/mobile-sites/).

Impact

Issue

High

Document uses legible font sizes

Language and Encoding

  • Language Detected

    JA

  • Language Claimed

    JA

  • Encoding

    UTF-8

Language claimed in HTML meta tag should match the language actually used on the web page. Otherwise Conference.e840.net can be misinterpreted by Google and other search engines. Our service has detected that Japanese is used on the page, and it matches the claimed language. Our system also found out that Conference.e840.net main page’s claimed encoding is utf-8. Use of this encoding format is the best practice as the main page visitors from all over the world won’t have any issues with symbol transcription.

Social Sharing Optimization

Open Graph description is not detected on the main page of Conference E 840. Lack of Open Graph description can be counter-productive for their social media presence, as such a description allows converting a website homepage (or other pages) into good-looking, rich and well-structured posts, when it is being shared on Facebook and other social media. For example, adding the following code snippet into HTML <head> tag will help to represent this web page correctly in social networks: