Report Summary

  • 52

    Performance

    Renders faster than
    70% of other websites

  • 91

    Accessibility

    Visual factors better than
    that of 77% of websites

  • 75

    Best Practices

    More advanced features
    available than in
    36% of websites

  • 92

    SEO

    Google-friendlier than
    75% of websites

flood.com

Explore Flood® Wood Finishes for Quality Protection and Beauty

Page Load Speed

2.2 sec in total

First Response

63 ms

Resources Loaded

1.7 sec

Page Rendered

462 ms
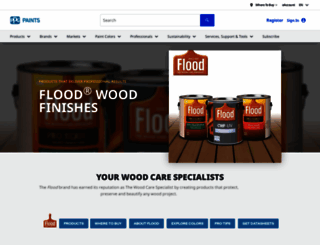
flood.com screenshot

About Website

Click here to check amazing Flood content for United States. Otherwise, check out these important facts you probably never knew about flood.com

Flood wood stains and other Flood stain products are designed to protect and beautify natural woods and other challenging surfaces.

Visit flood.com

Key Findings

We analyzed Flood.com page load time and found that the first response time was 63 ms and then it took 2.2 sec to load all DOM resources and completely render a web page. This is quite a good result, as only 40% of websites can load faster.

Performance Metrics

flood.com performance score

52

Measured Metrics

name

value

score

weighting

FCP (First Contentful Paint)

Value2.9 s

53/100

10%

LCP (Largest Contentful Paint)

Value10.0 s

0/100

25%

SI (Speed Index)

Value3.5 s

88/100

10%

TBT (Total Blocking Time)

Value60 ms

100/100

30%

CLS (Cumulative Layout Shift)

Value0.768

5/100

15%

TTI (Time to Interactive)

Value5.4 s

72/100

10%

Network Requests Diagram

flood.com

63 ms

www.flood.com

338 ms

gtm.js

293 ms

flood-logo-retina.png

137 ms

jquery.min.js

321 ms

Our browser made a total of 36 requests to load all elements on the main page. We found that 72% of them (26 requests) were addressed to the original Flood.com, 6% (2 requests) were made to Ajax.googleapis.com and 6% (2 requests) were made to Google-analytics.com. The less responsive or slowest element that took the longest time to load (659 ms) belongs to the original domain Flood.com.

Page Optimization Overview & Recommendations

Page size can be reduced by 190.4 kB (13%)

Content Size

1.4 MB

After Optimization

1.2 MB

In fact, the total size of Flood.com main page is 1.4 MB. This result falls beyond the top 1M of websites and identifies a large and not optimized web page that may take ages to load. 40% of websites need less resources to load. Images take 1.2 MB which makes up the majority of the site volume.

HTML Optimization

-70%

Potential reduce by 8.7 kB

  • Original 12.4 kB
  • After minification 11.0 kB
  • After compression 3.7 kB

HTML content can be minified and compressed by a website’s server. The most efficient way is to compress content using GZIP which reduces data amount travelling through the network between server and browser. This page needs HTML code to be minified as it can gain 1.5 kB, which is 12% of the original size. It is highly recommended that content of this web page should be compressed using GZIP, as it can save up to 8.7 kB or 70% of the original size.

Image Optimization

-5%

Potential reduce by 57.7 kB

  • Original 1.2 MB
  • After minification 1.1 MB

Image size optimization can help to speed up a website loading time. The chart above shows the difference between the size before and after optimization. Flood images are well optimized though.

JavaScript Optimization

-50%

Potential reduce by 99.2 kB

  • Original 196.9 kB
  • After minification 192.0 kB
  • After compression 97.7 kB

It’s better to minify JavaScript in order to improve website performance. The diagram shows the current total size of all JavaScript files against the prospective JavaScript size after its minification and compression. It is highly recommended that all JavaScript files should be compressed and minified as it can save up to 99.2 kB or 50% of the original size.

CSS Optimization

-80%

Potential reduce by 24.7 kB

  • Original 30.8 kB
  • After minification 24.5 kB
  • After compression 6.1 kB

CSS files minification is very important to reduce a web page rendering time. The faster CSS files can load, the earlier a page can be rendered. Flood.com needs all CSS files to be minified and compressed as it can save up to 24.7 kB or 80% of the original size.

Requests Breakdown

Number of requests can be reduced by 11 (37%)

Requests Now

30

After Optimization

19

The browser has sent 30 CSS, Javascripts, AJAX and image requests in order to completely render the main page of Flood. We recommend that multiple CSS and JavaScript files should be merged into one by each type, as it can help reduce assets requests from 12 to 1 for JavaScripts and as a result speed up the page load time.

Accessibility Review

flood.com accessibility score

91

Accessibility Issues

Best practices

These items highlight common accessibility best practices.

Impact

Issue

High

[user-scalable="no"] is used in the <meta name="viewport"> element or the [maximum-scale] attribute is less than 5.

Best Practices

flood.com best practices score

75

Areas of Improvement

Trust and Safety

Impact

Issue

High

Does not use HTTPS

High

Includes front-end JavaScript libraries with known security vulnerabilities

Low

Ensure CSP is effective against XSS attacks

General

Impact

Issue

Low

Detected JavaScript libraries

High

Browser errors were logged to the console

High

Page has valid source maps

SEO Factors

flood.com SEO score

92

Search Engine Optimization Advices

Mobile Friendly

Make sure your pages are mobile friendly so users don’t have to pinch or zoom in order to read the content pages. [Learn more](https://developers.google.com/search/mobile-sites/).

Impact

Issue

High

Document uses legible font sizes

Language and Encoding

  • Language Detected

    EN

  • Language Claimed

    N/A

  • Encoding

    UTF-8

Language claimed in HTML meta tag should match the language actually used on the web page. Otherwise Flood.com can be misinterpreted by Google and other search engines. Our service has detected that English is used on the page, and neither this language nor any other was claimed in <html> or <meta> tags. Our system also found out that Flood.com main page’s claimed encoding is utf-8. Use of this encoding format is the best practice as the main page visitors from all over the world won’t have any issues with symbol transcription.

Social Sharing Optimization

Open Graph description is not detected on the main page of Flood. Lack of Open Graph description can be counter-productive for their social media presence, as such a description allows converting a website homepage (or other pages) into good-looking, rich and well-structured posts, when it is being shared on Facebook and other social media. For example, adding the following code snippet into HTML <head> tag will help to represent this web page correctly in social networks: