Report Summary

  • 28

    Performance

    Renders faster than
    48% of other websites

  • 98

    Accessibility

    Visual factors better than
    that of 94% of websites

  • 92

    Best Practices

    More advanced features
    available than in
    81% of websites

  • 93

    SEO

    Google-friendlier than
    84% of websites

groovebone.org

Home - Becarman News

Page Load Speed

3.9 sec in total

First Response

770 ms

Resources Loaded

2.9 sec

Page Rendered

313 ms
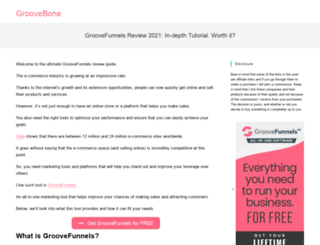
groovebone.org screenshot

About Website

Visit groovebone.org now to see the best up-to-date Groovebone content and also check out these interesting facts you probably never knew about groovebone.org

株を始める場合には証券会社に口座を作る必要があります。郵便局や銀行などに口座を開設している人は沢山いると思いますが、銀行口座と証券会社に開設する口座の違いは何でしょうか?

Visit groovebone.org

Key Findings

We analyzed Groovebone.org page load time and found that the first response time was 770 ms and then it took 3.2 sec to load all DOM resources and completely render a web page. This is a poor result, as 55% of websites can load faster.

Performance Metrics

groovebone.org performance score

28

Measured Metrics

name

value

score

weighting

FCP (First Contentful Paint)

Value3.2 s

43/100

10%

LCP (Largest Contentful Paint)

Value15.0 s

0/100

25%

SI (Speed Index)

Value7.7 s

25/100

10%

TBT (Total Blocking Time)

Value1,160 ms

21/100

30%

CLS (Cumulative Layout Shift)

Value0

100/100

15%

TTI (Time to Interactive)

Value19.7 s

2/100

10%

Network Requests Diagram

www.groovebone.org

770 ms

clear.css

232 ms

init.css

237 ms

hover.css

708 ms

hover-min.css

595 ms

Our browser made a total of 14 requests to load all elements on the main page. We found that 93% of them (13 requests) were addressed to the original Groovebone.org, 7% (1 request) were made to Iesthalassa.net. The less responsive or slowest element that took the longest time to load (770 ms) belongs to the original domain Groovebone.org.

Page Optimization Overview & Recommendations

Page size can be reduced by 355.2 kB (65%)

Content Size

547.7 kB

After Optimization

192.5 kB

In fact, the total size of Groovebone.org main page is 547.7 kB. This result falls beyond the top 1M of websites and identifies a large and not optimized web page that may take ages to load. Only 10% of websites need less resources to load. CSS take 256.1 kB which makes up the majority of the site volume.

HTML Optimization

-65%

Potential reduce by 11.5 kB

  • Original 17.6 kB
  • After minification 17.2 kB
  • After compression 6.1 kB

HTML content can be minified and compressed by a website’s server. The most efficient way is to compress content using GZIP which reduces data amount travelling through the network between server and browser. HTML code on this page is well minified. It is highly recommended that content of this web page should be compressed using GZIP, as it can save up to 11.5 kB or 65% of the original size.

Image Optimization

-3%

Potential reduce by 3.5 kB

  • Original 120.8 kB
  • After minification 117.3 kB

Image size optimization can help to speed up a website loading time. The chart above shows the difference between the size before and after optimization. Groovebone images are well optimized though.

JavaScript Optimization

-66%

Potential reduce by 100.5 kB

  • Original 153.2 kB
  • After minification 153.1 kB
  • After compression 52.7 kB

It’s better to minify JavaScript in order to improve website performance. The diagram shows the current total size of all JavaScript files against the prospective JavaScript size after its minification and compression. It is highly recommended that all JavaScript files should be compressed and minified as it can save up to 100.5 kB or 66% of the original size.

CSS Optimization

-94%

Potential reduce by 239.7 kB

  • Original 256.1 kB
  • After minification 217.2 kB
  • After compression 16.4 kB

CSS files minification is very important to reduce a web page rendering time. The faster CSS files can load, the earlier a page can be rendered. Groovebone.org needs all CSS files to be minified and compressed as it can save up to 239.7 kB or 94% of the original size.

Requests Breakdown

Number of requests can be reduced by 4 (31%)

Requests Now

13

After Optimization

9

The browser has sent 13 CSS, Javascripts, AJAX and image requests in order to completely render the main page of Groovebone. We recommend that multiple CSS and JavaScript files should be merged into one by each type, as it can help reduce assets requests from 5 to 1 for CSS and as a result speed up the page load time.

Accessibility Review

groovebone.org accessibility score

98

Accessibility Issues

Contrast

These are opportunities to improve the legibility of your content.

Impact

Issue

High

Background and foreground colors do not have a sufficient contrast ratio.

Best Practices

groovebone.org best practices score

92

Areas of Improvement

Trust and Safety

Impact

Issue

High

Does not use HTTPS

Low

Ensure CSP is effective against XSS attacks

General

Impact

Issue

Low

Detected JavaScript libraries

SEO Factors

groovebone.org SEO score

93

Search Engine Optimization Advices

Crawling and Indexing

To appear in search results, crawlers need access to your app.

Impact

Issue

High

Links are not crawlable

Mobile Friendly

Make sure your pages are mobile friendly so users don’t have to pinch or zoom in order to read the content pages. [Learn more](https://developers.google.com/search/mobile-sites/).

Impact

Issue

High

Document uses legible font sizes

Language and Encoding

  • Language Detected

    EN

  • Language Claimed

    JA

  • Encoding

    UTF-8

Language claimed in HTML meta tag should match the language actually used on the web page. Otherwise Groovebone.org can be misinterpreted by Google and other search engines. Our service has detected that English is used on the page, and it does not match the claimed Japanese language. Our system also found out that Groovebone.org main page’s claimed encoding is utf-8. Use of this encoding format is the best practice as the main page visitors from all over the world won’t have any issues with symbol transcription.

Social Sharing Optimization

Open Graph data is detected on the main page of PARSED_DOMAIN, but there is no image specified in description. It would be a good idea for the website admin to select a nice image that can properly represent the website in Open Graph data, otherwise the first found image will be taken for this purpose and social media information block will look like this: