Report Summary

  • 18

    Performance

    Renders faster than
    34% of other websites

  • 88

    Accessibility

    Visual factors better than
    that of 69% of websites

  • 83

    Best Practices

    More advanced features
    available than in
    56% of websites

  • 92

    SEO

    Google-friendlier than
    75% of websites

jetbrains.org

IntelliJ Platform: Open Source Platform for Building Developer Tools

Page Load Speed

1.3 sec in total

First Response

80 ms

Resources Loaded

1.1 sec

Page Rendered

181 ms
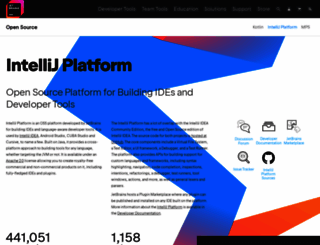
jetbrains.org screenshot

About Website

Visit jetbrains.org now to see the best up-to-date Jetbrains content for Iran and also check out these interesting facts you probably never knew about jetbrains.org

Welcome to the IntelliJ Community\! This is the home for the opensource project IntelliJ IDEA Community Edition IJOS:What is IntelliJ IDEA Community Edition? − the leading Java and Groovy IDE bu...

Visit jetbrains.org

Key Findings

We analyzed Jetbrains.org page load time and found that the first response time was 80 ms and then it took 1.2 sec to load all DOM resources and completely render a web page. This is quite a good result, as only 25% of websites can load faster.

Performance Metrics

jetbrains.org performance score

18

Measured Metrics

name

value

score

weighting

FCP (First Contentful Paint)

Value12.5 s

0/100

10%

LCP (Largest Contentful Paint)

Value15.3 s

0/100

25%

SI (Speed Index)

Value12.5 s

3/100

10%

TBT (Total Blocking Time)

Value1,840 ms

9/100

30%

CLS (Cumulative Layout Shift)

Value0.069

96/100

15%

TTI (Time to Interactive)

Value17.0 s

4/100

10%

Network Requests Diagram

jetbrains.org

80 ms

Home;jsessionid=715533B24D730B3C09E978BFAA22151D

116 ms

confluence.web.resources:master-styles.css

124 ms

com.atlassian.auiplugin:jquery.js

154 ms

com.atlassian.auiplugin:jquery-base.js

77 ms

Our browser made a total of 78 requests to load all elements on the main page. We found that 82% of them (64 requests) were addressed to the original Jetbrains.org, 8% (6 requests) were made to Google-analytics.com and 3% (2 requests) were made to Munchkin.marketo.net. The less responsive or slowest element that took the longest time to load (365 ms) belongs to the original domain Jetbrains.org.

Page Optimization Overview & Recommendations

Page size can be reduced by 57.5 kB (53%)

Content Size

108.3 kB

After Optimization

50.8 kB

In fact, the total size of Jetbrains.org main page is 108.3 kB. This result falls beyond the top 1M of websites and identifies a large and not optimized web page that may take ages to load. 30% of websites need less resources to load. Javascripts take 82.8 kB which makes up the majority of the site volume.

HTML Optimization

-78%

Potential reduce by 19.9 kB

  • Original 25.5 kB
  • After minification 23.0 kB
  • After compression 5.6 kB

HTML content can be minified and compressed by a website’s server. The most efficient way is to compress content using GZIP which reduces data amount travelling through the network between server and browser. HTML code on this page is well minified. It is highly recommended that content of this web page should be compressed using GZIP, as it can save up to 19.9 kB or 78% of the original size.

JavaScript Optimization

-45%

Potential reduce by 37.6 kB

  • Original 82.8 kB
  • After minification 80.6 kB
  • After compression 45.2 kB

It’s better to minify JavaScript in order to improve website performance. The diagram shows the current total size of all JavaScript files against the prospective JavaScript size after its minification and compression. It is highly recommended that all JavaScript files should be compressed and minified as it can save up to 37.6 kB or 45% of the original size.

Requests Breakdown

Number of requests can be reduced by 65 (87%)

Requests Now

75

After Optimization

10

The browser has sent 75 CSS, Javascripts, AJAX and image requests in order to completely render the main page of Jetbrains. We recommend that multiple CSS and JavaScript files should be merged into one by each type, as it can help reduce assets requests from 30 to 1 for JavaScripts and from 19 to 1 for CSS and as a result speed up the page load time.

Accessibility Review

jetbrains.org accessibility score

88

Accessibility Issues

Contrast

These are opportunities to improve the legibility of your content.

Impact

Issue

High

Background and foreground colors do not have a sufficient contrast ratio.

Best practices

These items highlight common accessibility best practices.

Impact

Issue

High

[user-scalable="no"] is used in the <meta name="viewport"> element or the [maximum-scale] attribute is less than 5.

Best Practices

jetbrains.org best practices score

83

Areas of Improvement

Trust and Safety

Impact

Issue

High

Does not use HTTPS

High

Includes front-end JavaScript libraries with known security vulnerabilities

Low

Ensure CSP is effective against XSS attacks

General

Impact

Issue

Low

Detected JavaScript libraries

High

Missing source maps for large first-party JavaScript

SEO Factors

jetbrains.org SEO score

92

Search Engine Optimization Advices

Mobile Friendly

Make sure your pages are mobile friendly so users don’t have to pinch or zoom in order to read the content pages. [Learn more](https://developers.google.com/search/mobile-sites/).

Impact

Issue

High

Document uses legible font sizes

Language and Encoding

  • Language Detected

    EN

  • Language Claimed

    N/A

  • Encoding

    N/A

Language claimed in HTML meta tag should match the language actually used on the web page. Otherwise Jetbrains.org can be misinterpreted by Google and other search engines. Our service has detected that English is used on the page, and neither this language nor any other was claimed in <html> or <meta> tags. Our system also found out that Jetbrains.org main page’s claimed encoding is . Changing it to UTF-8 can be a good choice, as this format is commonly used for encoding all over the web and thus their visitors won’t have any troubles with symbol transcription or reading.

Social Sharing Optimization

Open Graph description is not detected on the main page of Jetbrains. Lack of Open Graph description can be counter-productive for their social media presence, as such a description allows converting a website homepage (or other pages) into good-looking, rich and well-structured posts, when it is being shared on Facebook and other social media. For example, adding the following code snippet into HTML <head> tag will help to represent this web page correctly in social networks: