Report Summary

  • 31

    Performance

    Renders faster than
    51% of other websites

  • 69

    Accessibility

    Visual factors better than
    that of 35% of websites

  • 67

    Best Practices

    More advanced features
    available than in
    24% of websites

  • 64

    SEO

    Google-friendlier than
    24% of websites

jotaefege.com

jotaefege

Page Load Speed

9.8 sec in total

First Response

529 ms

Resources Loaded

9.1 sec

Page Rendered

176 ms
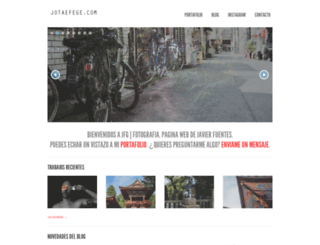
jotaefege.com screenshot

About Website

Visit jotaefege.com now to see the best up-to-date Jotaefege content and also check out these interesting facts you probably never knew about jotaefege.com

Blog sobre todo lo relacionado con la fotografía y galeria fotográfica de Javier Fuentes

Visit jotaefege.com

Key Findings

We analyzed Jotaefege.com page load time and found that the first response time was 529 ms and then it took 9.3 sec to load all DOM resources and completely render a web page. This is a poor result, as 85% of websites can load faster.

Performance Metrics

jotaefege.com performance score

31

Measured Metrics

name

value

score

weighting

FCP (First Contentful Paint)

Value8.8 s

0/100

10%

LCP (Largest Contentful Paint)

Value8.9 s

1/100

25%

SI (Speed Index)

Value18.2 s

0/100

10%

TBT (Total Blocking Time)

Value230 ms

86/100

30%

CLS (Cumulative Layout Shift)

Value0.391

26/100

15%

TTI (Time to Interactive)

Value13.6 s

11/100

10%

Network Requests Diagram

fotografia

529 ms

3865 ms

style.css

335 ms

custom.css

235 ms

prettyPhoto.css

332 ms

Our browser made a total of 63 requests to load all elements on the main page. We found that 76% of them (48 requests) were addressed to the original Jotaefege.com, 13% (8 requests) were made to Apis.google.com and 5% (3 requests) were made to Google-analytics.com. The less responsive or slowest element that took the longest time to load (3.9 sec) belongs to the original domain Jotaefege.com.

Page Optimization Overview & Recommendations

Page size can be reduced by 292.1 kB (35%)

Content Size

832.2 kB

After Optimization

540.1 kB

In fact, the total size of Jotaefege.com main page is 832.2 kB. This result falls beyond the top 1M of websites and identifies a large and not optimized web page that may take ages to load. 55% of websites need less resources to load. Images take 437.2 kB which makes up the majority of the site volume.

HTML Optimization

-77%

Potential reduce by 23.3 kB

  • Original 30.2 kB
  • After minification 26.3 kB
  • After compression 6.9 kB

HTML content can be minified and compressed by a website’s server. The most efficient way is to compress content using GZIP which reduces data amount travelling through the network between server and browser. This page needs HTML code to be minified as it can gain 3.9 kB, which is 13% of the original size. It is highly recommended that content of this web page should be compressed using GZIP, as it can save up to 23.3 kB or 77% of the original size.

Image Optimization

-3%

Potential reduce by 12.4 kB

  • Original 437.2 kB
  • After minification 424.8 kB

Image size optimization can help to speed up a website loading time. The chart above shows the difference between the size before and after optimization. Jotaefege images are well optimized though.

JavaScript Optimization

-66%

Potential reduce by 185.8 kB

  • Original 280.2 kB
  • After minification 260.9 kB
  • After compression 94.5 kB

It’s better to minify JavaScript in order to improve website performance. The diagram shows the current total size of all JavaScript files against the prospective JavaScript size after its minification and compression. It is highly recommended that all JavaScript files should be compressed and minified as it can save up to 185.8 kB or 66% of the original size.

CSS Optimization

-83%

Potential reduce by 70.7 kB

  • Original 84.6 kB
  • After minification 68.4 kB
  • After compression 14.0 kB

CSS files minification is very important to reduce a web page rendering time. The faster CSS files can load, the earlier a page can be rendered. Jotaefege.com needs all CSS files to be minified and compressed as it can save up to 70.7 kB or 83% of the original size.

Requests Breakdown

Number of requests can be reduced by 39 (65%)

Requests Now

60

After Optimization

21

The browser has sent 60 CSS, Javascripts, AJAX and image requests in order to completely render the main page of Jotaefege. We recommend that multiple CSS and JavaScript files should be merged into one by each type, as it can help reduce assets requests from 31 to 1 for JavaScripts and from 10 to 1 for CSS and as a result speed up the page load time.

Accessibility Review

jotaefege.com accessibility score

69

Accessibility Issues

Contrast

These are opportunities to improve the legibility of your content.

Impact

Issue

High

Background and foreground colors do not have a sufficient contrast ratio.

Names and labels

These are opportunities to improve the semantics of the controls in your application. This may enhance the experience for users of assistive technology, like a screen reader.

Impact

Issue

High

<frame> or <iframe> elements do not have a title

High

Links do not have a discernible name

Navigation

These are opportunities to improve keyboard navigation in your application.

Impact

Issue

High

Heading elements are not in a sequentially-descending order

Internationalization and localization

These are opportunities to improve the interpretation of your content by users in different locales.

Impact

Issue

High

<html> element does not have a [lang] attribute

Tables and lists

These are opportunities to improve the experience of reading tabular or list data using assistive technology, like a screen reader.

Impact

Issue

High

Lists do not contain only <li> elements and script supporting elements (<script> and <template>).

Best Practices

jotaefege.com best practices score

67

Areas of Improvement

Trust and Safety

Impact

Issue

High

Does not use HTTPS

High

Includes front-end JavaScript libraries with known security vulnerabilities

Low

Ensure CSP is effective against XSS attacks

User Experience

Impact

Issue

High

Serves images with low resolution

General

Impact

Issue

Low

Detected JavaScript libraries

High

Browser errors were logged to the console

SEO Factors

jotaefege.com SEO score

64

Search Engine Optimization Advices

Crawling and Indexing

To appear in search results, crawlers need access to your app.

Impact

Issue

High

Links are not crawlable

Language and Encoding

  • Language Detected

    ES

  • Language Claimed

    N/A

  • Encoding

    UTF-8

Language claimed in HTML meta tag should match the language actually used on the web page. Otherwise Jotaefege.com can be misinterpreted by Google and other search engines. Our service has detected that Spanish is used on the page, and neither this language nor any other was claimed in <html> or <meta> tags. Our system also found out that Jotaefege.com main page’s claimed encoding is utf-8. Use of this encoding format is the best practice as the main page visitors from all over the world won’t have any issues with symbol transcription.

Social Sharing Optimization

Open Graph description is not detected on the main page of Jotaefege. Lack of Open Graph description can be counter-productive for their social media presence, as such a description allows converting a website homepage (or other pages) into good-looking, rich and well-structured posts, when it is being shared on Facebook and other social media. For example, adding the following code snippet into HTML <head> tag will help to represent this web page correctly in social networks: