Report Summary

  • 24

    Performance

    Renders faster than
    43% of other websites

  • 67

    Accessibility

    Visual factors better than
    that of 32% of websites

  • 75

    Best Practices

    More advanced features
    available than in
    35% of websites

  • 84

    SEO

    Google-friendlier than
    52% of websites

letscheck.in

Letscheckin - Watch Your Favorite Content, Engage with Content Creators, and More

Page Load Speed

1.3 sec in total

First Response

68 ms

Resources Loaded

1.1 sec

Page Rendered

100 ms
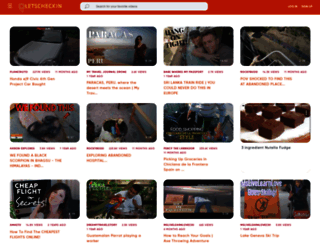
letscheck.in screenshot

About Website

Visit letscheck.in now to see the best up-to-date Letscheck content for Ukraine and also check out these interesting facts you probably never knew about letscheck.in

Sign up for a Letscheckin account and watch your favorite content, engage with content creators, and more

Visit letscheck.in

Key Findings

We analyzed Letscheck.in page load time and found that the first response time was 68 ms and then it took 1.2 sec to load all DOM resources and completely render a web page. This is quite a good result, as only 25% of websites can load faster.

Performance Metrics

letscheck.in performance score

24

Measured Metrics

name

value

score

weighting

FCP (First Contentful Paint)

Value3.0 s

49/100

10%

LCP (Largest Contentful Paint)

Value10.0 s

0/100

25%

SI (Speed Index)

Value7.5 s

26/100

10%

TBT (Total Blocking Time)

Value3,480 ms

2/100

30%

CLS (Cumulative Layout Shift)

Value0

100/100

15%

TTI (Time to Interactive)

Value16.1 s

6/100

10%

Network Requests Diagram

letscheck.in

68 ms

letscheck.in

483 ms

jquery.js

22 ms

jquery-ui.min.js

72 ms

jquery.validate.min.js

117 ms

Our browser made a total of 41 requests to load all elements on the main page. We found that 76% of them (31 requests) were addressed to the original Letscheck.in, 5% (2 requests) were made to Platform.twitter.com and 5% (2 requests) were made to Google-analytics.com. The less responsive or slowest element that took the longest time to load (483 ms) belongs to the original domain Letscheck.in.

Page Optimization Overview & Recommendations

Page size can be reduced by 71.1 kB (23%)

Content Size

313.6 kB

After Optimization

242.6 kB

In fact, the total size of Letscheck.in main page is 313.6 kB. This result falls beyond the top 1M of websites and identifies a large and not optimized web page that may take ages to load. 80% of websites need less resources to load and that’s why Accessify’s recommendations for optimization and resource minification can be helpful for this project. Javascripts take 160.0 kB which makes up the majority of the site volume.

HTML Optimization

-86%

Potential reduce by 53.5 kB

  • Original 62.1 kB
  • After minification 42.8 kB
  • After compression 8.6 kB

HTML content can be minified and compressed by a website’s server. The most efficient way is to compress content using GZIP which reduces data amount travelling through the network between server and browser. This page needs HTML code to be minified as it can gain 19.3 kB, which is 31% of the original size. It is highly recommended that content of this web page should be compressed using GZIP, as it can save up to 53.5 kB or 86% of the original size.

Image Optimization

-6%

Potential reduce by 4.4 kB

  • Original 78.1 kB
  • After minification 73.6 kB

Image size optimization can help to speed up a website loading time. The chart above shows the difference between the size before and after optimization. Letscheck images are well optimized though.

JavaScript Optimization

-7%

Potential reduce by 11.1 kB

  • Original 160.0 kB
  • After minification 160.0 kB
  • After compression 149.0 kB

It’s better to minify JavaScript in order to improve website performance. The diagram shows the current total size of all JavaScript files against the prospective JavaScript size after its minification and compression. This website has mostly compressed JavaScripts.

CSS Optimization

-16%

Potential reduce by 2.1 kB

  • Original 13.5 kB
  • After minification 13.5 kB
  • After compression 11.4 kB

CSS files minification is very important to reduce a web page rendering time. The faster CSS files can load, the earlier a page can be rendered. Letscheck.in needs all CSS files to be minified and compressed as it can save up to 2.1 kB or 16% of the original size.

Requests Breakdown

Number of requests can be reduced by 27 (79%)

Requests Now

34

After Optimization

7

The browser has sent 34 CSS, Javascripts, AJAX and image requests in order to completely render the main page of Letscheck. We recommend that multiple CSS and JavaScript files should be merged into one by each type, as it can help reduce assets requests from 16 to 1 for JavaScripts and from 13 to 1 for CSS and as a result speed up the page load time.

Accessibility Review

letscheck.in accessibility score

67

Accessibility Issues

ARIA

These are opportunities to improve the usage of ARIA in your application which may enhance the experience for users of assistive technology, like a screen reader.

Impact

Issue

High

[aria-*] attributes do not match their roles

Contrast

These are opportunities to improve the legibility of your content.

Impact

Issue

High

Background and foreground colors do not have a sufficient contrast ratio.

Names and labels

These are opportunities to improve the semantics of the controls in your application. This may enhance the experience for users of assistive technology, like a screen reader.

Impact

Issue

High

<frame> or <iframe> elements do not have a title

High

Image elements do not have [alt] attributes

High

Links do not have a discernible name

Internationalization and localization

These are opportunities to improve the interpretation of your content by users in different locales.

Impact

Issue

High

<html> element does not have a [lang] attribute

Best Practices

letscheck.in best practices score

75

Areas of Improvement

Trust and Safety

Impact

Issue

High

Does not use HTTPS

High

Requests the geolocation permission on page load

High

Includes front-end JavaScript libraries with known security vulnerabilities

Low

Ensure CSP is effective against XSS attacks

General

Impact

Issue

Low

Detected JavaScript libraries

High

Page has valid source maps

SEO Factors

letscheck.in SEO score

84

Search Engine Optimization Advices

Crawling and Indexing

To appear in search results, crawlers need access to your app.

Impact

Issue

High

Links are not crawlable

Content Best Practices

Format your HTML in a way that enables crawlers to better understand your app’s content.

Impact

Issue

High

Image elements do not have [alt] attributes

Mobile Friendly

Make sure your pages are mobile friendly so users don’t have to pinch or zoom in order to read the content pages. [Learn more](https://developers.google.com/search/mobile-sites/).

Impact

Issue

High

Document uses legible font sizes

High

Tap targets are not sized appropriately

Language and Encoding

  • Language Detected

    EN

  • Language Claimed

    N/A

  • Encoding

    UTF-8

Language claimed in HTML meta tag should match the language actually used on the web page. Otherwise Letscheck.in can be misinterpreted by Google and other search engines. Our service has detected that English is used on the page, and neither this language nor any other was claimed in <html> or <meta> tags. Our system also found out that Letscheck.in main page’s claimed encoding is utf-8. Use of this encoding format is the best practice as the main page visitors from all over the world won’t have any issues with symbol transcription.

Social Sharing Optimization

Open Graph data is detected on the main page of Letscheck. This is the best way to make the web page social media friendly. Here is how it looks like on Facebook: