Report Summary

  • 16

    Performance

    Renders faster than
    30% of other websites

  • 98

    Accessibility

    Visual factors better than
    that of 94% of websites

  • 83

    Best Practices

    More advanced features
    available than in
    56% of websites

  • 99

    SEO

    Google-friendlier than
    93% of websites

blog.planoly.com

PLANOLY Blog: Social Media News, Tips, and Articles

Page Load Speed

2.1 sec in total

First Response

31 ms

Resources Loaded

1.8 sec

Page Rendered

325 ms
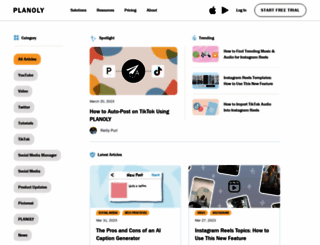
blog.planoly.com screenshot

About Website

Welcome to blog.planoly.com homepage info - get ready to check Blog PLANOLY best content for United States right away, or after learning these important things about blog.planoly.com

Find Instagram tips and social media marketing articles from the PLANOLY blog. Your source for social media news, marketing strategies, and updates

Visit blog.planoly.com

Key Findings

We analyzed Blog.planoly.com page load time and found that the first response time was 31 ms and then it took 2.1 sec to load all DOM resources and completely render a web page. This is quite a good result, as only 40% of websites can load faster.

Performance Metrics

blog.planoly.com performance score

16

Measured Metrics

name

value

score

weighting

FCP (First Contentful Paint)

Value11.2 s

0/100

10%

LCP (Largest Contentful Paint)

Value14.5 s

0/100

25%

SI (Speed Index)

Value13.5 s

2/100

10%

TBT (Total Blocking Time)

Value3,620 ms

1/100

30%

CLS (Cumulative Layout Shift)

Value0

100/100

15%

TTI (Time to Interactive)

Value23.8 s

1/100

10%

Network Requests Diagram

blog

31 ms

planoly.7ed295803.min.css

66 ms

webfont.js

131 ms

e67a120a59ea96a719d5a49e4354d053.js

106 ms

js

114 ms

Our browser made a total of 106 requests to load all elements on the main page. We found that 0% of them (0 request) were addressed to the original Blog.planoly.com, 27% (29 requests) were made to Fonts.gstatic.com and 6% (6 requests) were made to Dev.visualwebsiteoptimizer.com. The less responsive or slowest element that took the longest time to load (771 ms) relates to the external source Fonts.gstatic.com.

Page Optimization Overview & Recommendations

Page size can be reduced by 412.2 kB (8%)

Content Size

5.3 MB

After Optimization

4.9 MB

In fact, the total size of Blog.planoly.com main page is 5.3 MB. This result falls beyond the top 1M of websites and identifies a large and not optimized web page that may take ages to load. 85% of websites need less resources to load and that’s why Accessify’s recommendations for optimization and resource minification can be helpful for this project. Images take 4.5 MB which makes up the majority of the site volume.

HTML Optimization

-79%

Potential reduce by 66.2 kB

  • Original 83.4 kB
  • After minification 82.9 kB
  • After compression 17.2 kB

HTML content can be minified and compressed by a website’s server. The most efficient way is to compress content using GZIP which reduces data amount travelling through the network between server and browser. HTML code on this page is well minified. It is highly recommended that content of this web page should be compressed using GZIP, as it can save up to 66.2 kB or 79% of the original size.

Image Optimization

-8%

Potential reduce by 338.1 kB

  • Original 4.5 MB
  • After minification 4.1 MB

Image size optimization can help to speed up a website loading time. The chart above shows the difference between the size before and after optimization. Blog PLANOLY images are well optimized though.

JavaScript Optimization

-1%

Potential reduce by 7.8 kB

  • Original 627.1 kB
  • After minification 627.1 kB
  • After compression 619.3 kB

It’s better to minify JavaScript in order to improve website performance. The diagram shows the current total size of all JavaScript files against the prospective JavaScript size after its minification and compression. This website has mostly compressed JavaScripts.

CSS Optimization

-0%

Potential reduce by 0 B

  • Original 87.0 kB
  • After minification 87.0 kB
  • After compression 87.0 kB

CSS files minification is very important to reduce a web page rendering time. The faster CSS files can load, the earlier a page can be rendered. Blog.planoly.com has all CSS files already compressed.

Requests Breakdown

Number of requests can be reduced by 42 (58%)

Requests Now

72

After Optimization

30

The browser has sent 72 CSS, Javascripts, AJAX and image requests in order to completely render the main page of Blog PLANOLY. We recommend that multiple CSS and JavaScript files should be merged into one by each type, as it can help reduce assets requests from 33 to 1 for JavaScripts and as a result speed up the page load time.

Accessibility Review

blog.planoly.com accessibility score

98

Accessibility Issues

Internationalization and localization

These are opportunities to improve the interpretation of your content by users in different locales.

Impact

Issue

High

<html> element does not have a [lang] attribute

Best Practices

blog.planoly.com best practices score

83

Areas of Improvement

Trust and Safety

Impact

Issue

High

Does not use HTTPS

Low

Ensure CSP is effective against XSS attacks

General

Impact

Issue

Low

Detected JavaScript libraries

High

Browser errors were logged to the console

High

Missing source maps for large first-party JavaScript

SEO Factors

blog.planoly.com SEO score

99

Search Engine Optimization Advices

Mobile Friendly

Make sure your pages are mobile friendly so users don’t have to pinch or zoom in order to read the content pages. [Learn more](https://developers.google.com/search/mobile-sites/).

Impact

Issue

High

Document uses legible font sizes

High

Tap targets are not sized appropriately

Language and Encoding

  • Language Detected

    EN

  • Language Claimed

    N/A

  • Encoding

    UTF-8

Language claimed in HTML meta tag should match the language actually used on the web page. Otherwise Blog.planoly.com can be misinterpreted by Google and other search engines. Our service has detected that English is used on the page, and neither this language nor any other was claimed in <html> or <meta> tags. Our system also found out that Blog.planoly.com main page’s claimed encoding is utf-8. Use of this encoding format is the best practice as the main page visitors from all over the world won’t have any issues with symbol transcription.

Social Sharing Optimization

Open Graph data is detected on the main page of Blog PLANOLY. This is the best way to make the web page social media friendly. Here is how it looks like on Facebook: