Report Summary

  • 53

    Performance

    Renders faster than
    71% of other websites

  • 95

    Accessibility

    Visual factors better than
    that of 87% of websites

  • 92

    Best Practices

    More advanced features
    available than in
    81% of websites

  • 71

    SEO

    Google-friendlier than
    30% of websites

pitci.net

PCSL IT Consulting Institute | Product Testing Services, Data Feeds – Just another WordPress site

Page Load Speed

5.4 sec in total

First Response

951 ms

Resources Loaded

4.3 sec

Page Rendered

180 ms
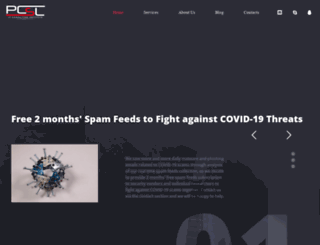
pitci.net screenshot

About Website

Click here to check amazing Pitci content. Otherwise, check out these important facts you probably never knew about pitci.net

Visit pitci.net

Key Findings

We analyzed Pitci.net page load time and found that the first response time was 951 ms and then it took 4.5 sec to load all DOM resources and completely render a web page. This is a poor result, as 65% of websites can load faster.

Performance Metrics

pitci.net performance score

53

Measured Metrics

name

value

score

weighting

FCP (First Contentful Paint)

Value3.3 s

39/100

10%

LCP (Largest Contentful Paint)

Value5.1 s

25/100

25%

SI (Speed Index)

Value8.7 s

16/100

10%

TBT (Total Blocking Time)

Value330 ms

76/100

30%

CLS (Cumulative Layout Shift)

Value0.003

100/100

15%

TTI (Time to Interactive)

Value9.3 s

31/100

10%

Network Requests Diagram

www.pitci.net

951 ms

www.pitci.net

1362 ms

wp-emoji-release.min.js

651 ms

google-font.css

491 ms

style.css

215 ms

Our browser made a total of 29 requests to load all elements on the main page. We found that 28% of them (8 requests) were addressed to the original Pitci.net, 72% (21 requests) were made to P.r.worldssl.net. The less responsive or slowest element that took the longest time to load (1.4 sec) belongs to the original domain Pitci.net.

Page Optimization Overview & Recommendations

Page size can be reduced by 688.5 kB (79%)

Content Size

869.9 kB

After Optimization

181.4 kB

In fact, the total size of Pitci.net main page is 869.9 kB. This result falls beyond the top 1M of websites and identifies a large and not optimized web page that may take ages to load. 25% of websites need less resources to load. CSS take 435.8 kB which makes up the majority of the site volume.

HTML Optimization

-82%

Potential reduce by 35.0 kB

  • Original 42.6 kB
  • After minification 38.4 kB
  • After compression 7.5 kB

HTML content can be minified and compressed by a website’s server. The most efficient way is to compress content using GZIP which reduces data amount travelling through the network between server and browser. HTML code on this page is well minified. It is highly recommended that content of this web page should be compressed using GZIP, as it can save up to 35.0 kB or 82% of the original size.

Image Optimization

-33%

Potential reduce by 24.2 kB

  • Original 72.6 kB
  • After minification 48.4 kB

Image size optimization can help to speed up a website loading time. The chart above shows the difference between the size before and after optimization. Obviously, Pitci needs image optimization as it can save up to 24.2 kB or 33% of the original volume. The most popular and efficient tools for JPEG and PNG image optimization are Jpegoptim and PNG Crush.

JavaScript Optimization

-75%

Potential reduce by 239.9 kB

  • Original 318.9 kB
  • After minification 273.6 kB
  • After compression 79.0 kB

It’s better to minify JavaScript in order to improve website performance. The diagram shows the current total size of all JavaScript files against the prospective JavaScript size after its minification and compression. It is highly recommended that all JavaScript files should be compressed and minified as it can save up to 239.9 kB or 75% of the original size.

CSS Optimization

-89%

Potential reduce by 389.4 kB

  • Original 435.8 kB
  • After minification 372.5 kB
  • After compression 46.4 kB

CSS files minification is very important to reduce a web page rendering time. The faster CSS files can load, the earlier a page can be rendered. Pitci.net needs all CSS files to be minified and compressed as it can save up to 389.4 kB or 89% of the original size.

Requests Breakdown

Number of requests can be reduced by 15 (56%)

Requests Now

27

After Optimization

12

The browser has sent 27 CSS, Javascripts, AJAX and image requests in order to completely render the main page of Pitci. We recommend that multiple CSS and JavaScript files should be merged into one by each type, as it can help reduce assets requests from 12 to 1 for JavaScripts and from 5 to 1 for CSS and as a result speed up the page load time.

Accessibility Review

pitci.net accessibility score

95

Accessibility Issues

Contrast

These are opportunities to improve the legibility of your content.

Impact

Issue

High

Background and foreground colors do not have a sufficient contrast ratio.

Navigation

These are opportunities to improve keyboard navigation in your application.

Impact

Issue

High

Heading elements are not in a sequentially-descending order

Best Practices

pitci.net best practices score

92

Areas of Improvement

Trust and Safety

Impact

Issue

High

Does not use HTTPS

Low

Ensure CSP is effective against XSS attacks

General

Impact

Issue

Low

Detected JavaScript libraries

SEO Factors

pitci.net SEO score

71

Search Engine Optimization Advices

Content Best Practices

Format your HTML in a way that enables crawlers to better understand your app’s content.

Impact

Issue

High

Links do not have descriptive text

Crawling and Indexing

To appear in search results, crawlers need access to your app.

Impact

Issue

High

Links are not crawlable

Mobile Friendly

Make sure your pages are mobile friendly so users don’t have to pinch or zoom in order to read the content pages. [Learn more](https://developers.google.com/search/mobile-sites/).

Impact

Issue

High

Document uses legible font sizes

Language and Encoding

  • Language Detected

    EN

  • Language Claimed

    EN

  • Encoding

    UTF-8

Language claimed in HTML meta tag should match the language actually used on the web page. Otherwise Pitci.net can be misinterpreted by Google and other search engines. Our service has detected that English is used on the page, and it matches the claimed language. Our system also found out that Pitci.net main page’s claimed encoding is utf-8. Use of this encoding format is the best practice as the main page visitors from all over the world won’t have any issues with symbol transcription.

Social Sharing Optimization

Open Graph description is not detected on the main page of Pitci. Lack of Open Graph description can be counter-productive for their social media presence, as such a description allows converting a website homepage (or other pages) into good-looking, rich and well-structured posts, when it is being shared on Facebook and other social media. For example, adding the following code snippet into HTML <head> tag will help to represent this web page correctly in social networks: