Report Summary

  • 21

    Performance

    Renders faster than
    39% of other websites

  • 84

    Accessibility

    Visual factors better than
    that of 57% of websites

  • 67

    Best Practices

    More advanced features
    available than in
    24% of websites

  • 82

    SEO

    Google-friendlier than
    44% of websites

Page Load Speed

29.3 sec in total

First Response

1.5 sec

Resources Loaded

26.3 sec

Page Rendered

1.5 sec
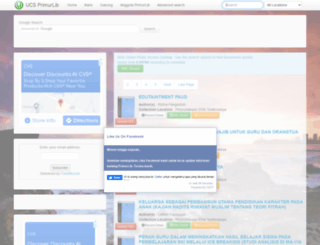
primurlib.net screenshot

About Website

Welcome to primurlib.net homepage info - get ready to check Primurlib best content for Indonesia right away, or after learning these important things about primurlib.net

UCS PrimurLib | Perpustakaan (SLiMS) Regional Priangan Timur Primurlib adalah Union Catalog Server (UCS) yang menyediakan servis Online Public Access Catalogue (OPAC) untuk instansi/perpustakaan di wi...

Visit primurlib.net

Key Findings

We analyzed Primurlib.net page load time and found that the first response time was 1.5 sec and then it took 27.8 sec to load all DOM resources and completely render a web page. This is a poor result, as 95% of websites can load faster. Unfortunately, there were 15 request timeouts, which can generally increase the web page load time, as the browser stays idle while waiting for website response.

Performance Metrics

primurlib.net performance score

21

Measured Metrics

name

value

score

weighting

FCP (First Contentful Paint)

Value2.8 s

56/100

10%

LCP (Largest Contentful Paint)

Value12.2 s

0/100

25%

SI (Speed Index)

Value7.7 s

24/100

10%

TBT (Total Blocking Time)

Value1,420 ms

15/100

30%

CLS (Cumulative Layout Shift)

Value0.236

53/100

15%

TTI (Time to Interactive)

Value18.4 s

3/100

10%

Network Requests Diagram

primurlib.net

1485 ms

bootstrap.min.css

2577 ms

bootstrap-responsive.min.css

605 ms

supersized.core.css

630 ms

style.css

630 ms

Our browser made a total of 188 requests to load all elements on the main page. We found that 18% of them (33 requests) were addressed to the original Primurlib.net, 17% (32 requests) were made to Scontent.xx.fbcdn.net and 15% (29 requests) were made to Static.xx.fbcdn.net. The less responsive or slowest element that took the longest time to load (20.2 sec) relates to the external source Feedage.net.

Page Optimization Overview & Recommendations

Page size can be reduced by 840.6 kB (54%)

Content Size

1.5 MB

After Optimization

703.8 kB

In fact, the total size of Primurlib.net main page is 1.5 MB. This result falls beyond the top 1M of websites and identifies a large and not optimized web page that may take ages to load. 70% of websites need less resources to load. Javascripts take 705.1 kB which makes up the majority of the site volume.

HTML Optimization

-88%

Potential reduce by 319.3 kB

  • Original 362.4 kB
  • After minification 359.0 kB
  • After compression 43.1 kB

HTML content can be minified and compressed by a website’s server. The most efficient way is to compress content using GZIP which reduces data amount travelling through the network between server and browser. HTML code on this page is well minified. It is highly recommended that content of this web page should be compressed using GZIP, as it can save up to 319.3 kB or 88% of the original size.

Image Optimization

-7%

Potential reduce by 24.3 kB

  • Original 358.1 kB
  • After minification 333.8 kB

Image size optimization can help to speed up a website loading time. The chart above shows the difference between the size before and after optimization. Primurlib images are well optimized though.

JavaScript Optimization

-57%

Potential reduce by 399.6 kB

  • Original 705.1 kB
  • After minification 696.8 kB
  • After compression 305.5 kB

It’s better to minify JavaScript in order to improve website performance. The diagram shows the current total size of all JavaScript files against the prospective JavaScript size after its minification and compression. It is highly recommended that all JavaScript files should be compressed and minified as it can save up to 399.6 kB or 57% of the original size.

CSS Optimization

-82%

Potential reduce by 97.5 kB

  • Original 118.9 kB
  • After minification 118.0 kB
  • After compression 21.3 kB

CSS files minification is very important to reduce a web page rendering time. The faster CSS files can load, the earlier a page can be rendered. Primurlib.net needs all CSS files to be minified and compressed as it can save up to 97.5 kB or 82% of the original size.

Requests Breakdown

Number of requests can be reduced by 81 (52%)

Requests Now

156

After Optimization

75

The browser has sent 156 CSS, Javascripts, AJAX and image requests in order to completely render the main page of Primurlib. We recommend that multiple CSS and JavaScript files should be merged into one by each type, as it can help reduce assets requests from 52 to 1 for JavaScripts and from 9 to 1 for CSS and as a result speed up the page load time.

Accessibility Review

primurlib.net accessibility score

84

Accessibility Issues

Contrast

These are opportunities to improve the legibility of your content.

Impact

Issue

High

Background and foreground colors do not have a sufficient contrast ratio.

Names and labels

These are opportunities to improve the semantics of the controls in your application. This may enhance the experience for users of assistive technology, like a screen reader.

Impact

Issue

High

<frame> or <iframe> elements do not have a title

High

Form elements do not have associated labels

High

Links do not have a discernible name

Best Practices

primurlib.net best practices score

67

Areas of Improvement

Trust and Safety

Impact

Issue

High

Does not use HTTPS

High

Includes front-end JavaScript libraries with known security vulnerabilities

Low

Ensure CSP is effective against XSS attacks

User Experience

Impact

Issue

High

Serves images with low resolution

General

Impact

Issue

Low

Detected JavaScript libraries

High

Browser errors were logged to the console

High

Page has valid source maps

SEO Factors

primurlib.net SEO score

82

Search Engine Optimization Advices

Content Best Practices

Format your HTML in a way that enables crawlers to better understand your app’s content.

Impact

Issue

High

Links do not have descriptive text

Crawling and Indexing

To appear in search results, crawlers need access to your app.

Impact

Issue

High

Links are not crawlable

Mobile Friendly

Make sure your pages are mobile friendly so users don’t have to pinch or zoom in order to read the content pages. [Learn more](https://developers.google.com/search/mobile-sites/).

Impact

Issue

High

Document uses legible font sizes

High

Tap targets are not sized appropriately

Language and Encoding

  • Language Detected

    N/A

  • Language Claimed

    EN

  • Encoding

    UTF-8

Language claimed in HTML meta tag should match the language actually used on the web page. Otherwise Primurlib.net can be misinterpreted by Google and other search engines. Unfortunately we cannot identify language used on the page (probably there is a mix of languages, too little text or something else), while the claimed language is English. Our system also found out that Primurlib.net main page’s claimed encoding is utf-8. Use of this encoding format is the best practice as the main page visitors from all over the world won’t have any issues with symbol transcription.

Social Sharing Optimization

Open Graph description is not detected on the main page of Primurlib. Lack of Open Graph description can be counter-productive for their social media presence, as such a description allows converting a website homepage (or other pages) into good-looking, rich and well-structured posts, when it is being shared on Facebook and other social media. For example, adding the following code snippet into HTML <head> tag will help to represent this web page correctly in social networks: