Report Summary

  • 42

    Performance

    Renders faster than
    61% of other websites

  • 84

    Accessibility

    Visual factors better than
    that of 57% of websites

  • 54

    Best Practices

    More advanced features
    available than in
    19% of websites

  • 62

    SEO

    Google-friendlier than
    22% of websites

proliability.com

Proliability - Home

Page Load Speed

3.4 sec in total

First Response

413 ms

Resources Loaded

2.7 sec

Page Rendered

290 ms
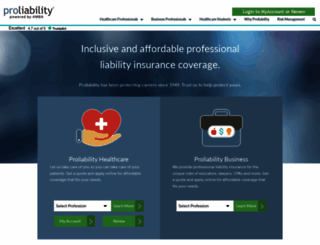
proliability.com screenshot

About Website

Click here to check amazing Proliability content for United States. Otherwise, check out these important facts you probably never knew about proliability.com

Explore Proliability for comprehensive professional liability insurance solutions. Protect your career and assets with customizable coverage options tailored for various professions. Discover peace of...

Visit proliability.com

Key Findings

We analyzed Proliability.com page load time and found that the first response time was 413 ms and then it took 3 sec to load all DOM resources and completely render a web page. This is a poor result, as 55% of websites can load faster.

Performance Metrics

proliability.com performance score

42

Measured Metrics

name

value

score

weighting

FCP (First Contentful Paint)

Value1.6 s

95/100

10%

LCP (Largest Contentful Paint)

Value7.4 s

5/100

25%

SI (Speed Index)

Value8.2 s

20/100

10%

TBT (Total Blocking Time)

Value680 ms

45/100

30%

CLS (Cumulative Layout Shift)

Value0.042

99/100

15%

TTI (Time to Interactive)

Value14.4 s

9/100

10%

Network Requests Diagram

www.proliability.com

413 ms

1125436112.js

145 ms

default.css

42 ms

module.css

27 ms

skin.css

49 ms

Our browser made a total of 132 requests to load all elements on the main page. We found that 46% of them (61 requests) were addressed to the original Proliability.com, 19% (25 requests) were made to Api.trustpilot.com and 5% (6 requests) were made to Widget.trustpilot.com. The less responsive or slowest element that took the longest time to load (1 sec) belongs to the original domain Proliability.com.

Page Optimization Overview & Recommendations

Page size can be reduced by 2.2 MB (56%)

Content Size

3.9 MB

After Optimization

1.7 MB

In fact, the total size of Proliability.com main page is 3.9 MB. This result falls beyond the top 1M of websites and identifies a large and not optimized web page that may take ages to load. 65% of websites need less resources to load. Javascripts take 1.9 MB which makes up the majority of the site volume.

HTML Optimization

-80%

Potential reduce by 108.7 kB

  • Original 136.0 kB
  • After minification 112.7 kB
  • After compression 27.3 kB

HTML content can be minified and compressed by a website’s server. The most efficient way is to compress content using GZIP which reduces data amount travelling through the network between server and browser. This page needs HTML code to be minified as it can gain 23.2 kB, which is 17% of the original size. It is highly recommended that content of this web page should be compressed using GZIP, as it can save up to 108.7 kB or 80% of the original size.

Image Optimization

-1%

Potential reduce by 12.3 kB

  • Original 1.1 MB
  • After minification 1.0 MB

Image size optimization can help to speed up a website loading time. The chart above shows the difference between the size before and after optimization. Proliability images are well optimized though.

JavaScript Optimization

-72%

Potential reduce by 1.4 MB

  • Original 1.9 MB
  • After minification 1.7 MB
  • After compression 551.2 kB

It’s better to minify JavaScript in order to improve website performance. The diagram shows the current total size of all JavaScript files against the prospective JavaScript size after its minification and compression. It is highly recommended that all JavaScript files should be compressed and minified as it can save up to 1.4 MB or 72% of the original size.

CSS Optimization

-87%

Potential reduce by 668.0 kB

  • Original 765.6 kB
  • After minification 605.7 kB
  • After compression 97.6 kB

CSS files minification is very important to reduce a web page rendering time. The faster CSS files can load, the earlier a page can be rendered. Proliability.com needs all CSS files to be minified and compressed as it can save up to 668.0 kB or 87% of the original size.

Requests Breakdown

Number of requests can be reduced by 99 (81%)

Requests Now

122

After Optimization

23

The browser has sent 122 CSS, Javascripts, AJAX and image requests in order to completely render the main page of Proliability. We recommend that multiple CSS and JavaScript files should be merged into one by each type, as it can help reduce assets requests from 66 to 1 for JavaScripts and from 16 to 1 for CSS and as a result speed up the page load time.

Accessibility Review

proliability.com accessibility score

84

Accessibility Issues

ARIA

These are opportunities to improve the usage of ARIA in your application which may enhance the experience for users of assistive technology, like a screen reader.

Impact

Issue

High

[aria-hidden="true"] elements contain focusable descendents

Names and labels

These are opportunities to improve the semantics of the controls in your application. This may enhance the experience for users of assistive technology, like a screen reader.

Impact

Issue

High

Buttons do not have an accessible name

High

Links do not have a discernible name

Contrast

These are opportunities to improve the legibility of your content.

Impact

Issue

High

Background and foreground colors do not have a sufficient contrast ratio.

Navigation

These are opportunities to improve keyboard navigation in your application.

Impact

Issue

High

Heading elements are not in a sequentially-descending order

Tables and lists

These are opportunities to improve the experience of reading tabular or list data using assistive technology, like a screen reader.

Impact

Issue

High

Lists do not contain only <li> elements and script supporting elements (<script> and <template>).

Best Practices

proliability.com best practices score

54

Areas of Improvement

Trust and Safety

Impact

Issue

High

Does not use HTTPS

High

Includes front-end JavaScript libraries with known security vulnerabilities

Low

Ensure CSP is effective against XSS attacks

User Experience

Impact

Issue

High

Serves images with low resolution

General

Impact

Issue

High

Registers an unload listener

Low

Detected JavaScript libraries

High

Browser errors were logged to the console

High

Missing source maps for large first-party JavaScript

High

Issues were logged in the Issues panel in Chrome Devtools

SEO Factors

proliability.com SEO score

62

Search Engine Optimization Advices

Crawling and Indexing

To appear in search results, crawlers need access to your app.

Impact

Issue

High

Links are not crawlable

Language and Encoding

  • Language Detected

    EN

  • Language Claimed

    EN

  • Encoding

    UTF-8

Language claimed in HTML meta tag should match the language actually used on the web page. Otherwise Proliability.com can be misinterpreted by Google and other search engines. Our service has detected that English is used on the page, and it matches the claimed language. Our system also found out that Proliability.com main page’s claimed encoding is utf-8. Use of this encoding format is the best practice as the main page visitors from all over the world won’t have any issues with symbol transcription.

Social Sharing Optimization

Open Graph description is not detected on the main page of Proliability. Lack of Open Graph description can be counter-productive for their social media presence, as such a description allows converting a website homepage (or other pages) into good-looking, rich and well-structured posts, when it is being shared on Facebook and other social media. For example, adding the following code snippet into HTML <head> tag will help to represent this web page correctly in social networks: