Report Summary

  • 54

    Performance

    Renders faster than
    72% of other websites

  • 92

    Accessibility

    Visual factors better than
    that of 80% of websites

  • 58

    Best Practices

    More advanced features
    available than in
    19% of websites

  • 73

    SEO

    Google-friendlier than
    31% of websites

proven.com

Get Proven's Complete Hiring Solution to easily manage all of your hiring needs.
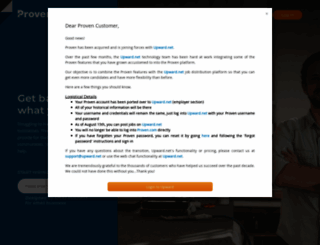
Page Load Speed

1.4 sec in total

First Response

100 ms

Resources Loaded

975 ms

Page Rendered

332 ms

proven.com screenshot

About Website

Click here to check amazing Proven content for Pakistan. Otherwise, check out these important facts you probably never knew about proven.com

Proven is #1 job post site for small businesses. Post jobs instantly to to multiple job boards with one click.

Visit proven.com

Key Findings

We analyzed Proven.com page load time and found that the first response time was 100 ms and then it took 1.3 sec to load all DOM resources and completely render a web page. This is quite a good result, as only 25% of websites can load faster.

Performance Metrics

proven.com performance score

54

Measured Metrics

name

value

score

weighting

FCP (First Contentful Paint)

Value4.1 s

21/100

10%

LCP (Largest Contentful Paint)

Value12.1 s

0/100

25%

SI (Speed Index)

Value4.7 s

68/100

10%

TBT (Total Blocking Time)

Value260 ms

84/100

30%

CLS (Cumulative Layout Shift)

Value0

100/100

15%

TTI (Time to Interactive)

Value7.4 s

48/100

10%

Network Requests Diagram

www.proven.com

100 ms

183741745.js

195 ms

bez0pso.js

58 ms

animate.css

6 ms

wow.min.js

6 ms

Our browser made a total of 51 requests to load all elements on the main page. We found that 39% of them (20 requests) were addressed to the original Proven.com, 27% (14 requests) were made to Use.typekit.net and 10% (5 requests) were made to Assets.zendesk.com. The less responsive or slowest element that took the longest time to load (247 ms) relates to the external source Use.typekit.net.

Page Optimization Overview & Recommendations

Page size can be reduced by 807.5 kB (40%)

Content Size

2.0 MB

After Optimization

1.2 MB

In fact, the total size of Proven.com main page is 2.0 MB. This result falls beyond the top 1M of websites and identifies a large and not optimized web page that may take ages to load. 65% of websites need less resources to load. Images take 1.0 MB which makes up the majority of the site volume.

HTML Optimization

-76%

Potential reduce by 21.8 kB

  • Original 28.7 kB
  • After minification 24.8 kB
  • After compression 7.0 kB

HTML content can be minified and compressed by a website’s server. The most efficient way is to compress content using GZIP which reduces data amount travelling through the network between server and browser. This page needs HTML code to be minified as it can gain 4.0 kB, which is 14% of the original size. It is highly recommended that content of this web page should be compressed using GZIP, as it can save up to 21.8 kB or 76% of the original size.

Image Optimization

-9%

Potential reduce by 97.6 kB

  • Original 1.0 MB
  • After minification 951.8 kB

Image size optimization can help to speed up a website loading time. The chart above shows the difference between the size before and after optimization. Proven images are well optimized though.

JavaScript Optimization

-63%

Potential reduce by 332.7 kB

  • Original 524.5 kB
  • After minification 520.8 kB
  • After compression 191.8 kB

It’s better to minify JavaScript in order to improve website performance. The diagram shows the current total size of all JavaScript files against the prospective JavaScript size after its minification and compression. It is highly recommended that all JavaScript files should be compressed and minified as it can save up to 332.7 kB or 63% of the original size.

CSS Optimization

-87%

Potential reduce by 355.4 kB

  • Original 408.2 kB
  • After minification 396.2 kB
  • After compression 52.8 kB

CSS files minification is very important to reduce a web page rendering time. The faster CSS files can load, the earlier a page can be rendered. Proven.com needs all CSS files to be minified and compressed as it can save up to 355.4 kB or 87% of the original size.

Requests Breakdown

Number of requests can be reduced by 18 (50%)

Requests Now

36

After Optimization

18

The browser has sent 36 CSS, Javascripts, AJAX and image requests in order to completely render the main page of Proven. We recommend that multiple CSS and JavaScript files should be merged into one by each type, as it can help reduce assets requests from 9 to 1 for JavaScripts and from 4 to 1 for CSS and as a result speed up the page load time.

Accessibility Review

proven.com accessibility score

92

Accessibility Issues

ARIA

These are opportunities to improve the usage of ARIA in your application which may enhance the experience for users of assistive technology, like a screen reader.

Impact

Issue

High

ARIA input fields do not have accessible names

Contrast

These are opportunities to improve the legibility of your content.

Impact

Issue

High

Background and foreground colors do not have a sufficient contrast ratio.

Navigation

These are opportunities to improve keyboard navigation in your application.

Impact

Issue

High

Heading elements are not in a sequentially-descending order

Internationalization and localization

These are opportunities to improve the interpretation of your content by users in different locales.

Impact

Issue

High

<html> element does not have a [lang] attribute

Names and labels

These are opportunities to improve the semantics of the controls in your application. This may enhance the experience for users of assistive technology, like a screen reader.

Impact

Issue

High

Links do not have a discernible name

Best Practices

proven.com best practices score

58

Areas of Improvement

Trust and Safety

Impact

Issue

High

Does not use HTTPS

High

Includes front-end JavaScript libraries with known security vulnerabilities

Low

Ensure CSP is effective against XSS attacks

General

Impact

Issue

Low

Detected JavaScript libraries

High

Browser errors were logged to the console

High

Issues were logged in the Issues panel in Chrome Devtools

SEO Factors

proven.com SEO score

73

Search Engine Optimization Advices

Content Best Practices

Format your HTML in a way that enables crawlers to better understand your app’s content.

Impact

Issue

High

Links do not have descriptive text

Crawling and Indexing

To appear in search results, crawlers need access to your app.

Impact

Issue

High

Links are not crawlable

Mobile Friendly

Make sure your pages are mobile friendly so users don’t have to pinch or zoom in order to read the content pages. [Learn more](https://developers.google.com/search/mobile-sites/).

Impact

Issue

High

Document uses legible font sizes

High

Tap targets are not sized appropriately

Language and Encoding

  • Language Detected

    EN

  • Language Claimed

    N/A

  • Encoding

    UTF-8

Language claimed in HTML meta tag should match the language actually used on the web page. Otherwise Proven.com can be misinterpreted by Google and other search engines. Our service has detected that English is used on the page, and neither this language nor any other was claimed in <html> or <meta> tags. Our system also found out that Proven.com main page’s claimed encoding is utf-8. Use of this encoding format is the best practice as the main page visitors from all over the world won’t have any issues with symbol transcription.

Social Sharing Optimization

Open Graph description is not detected on the main page of Proven. Lack of Open Graph description can be counter-productive for their social media presence, as such a description allows converting a website homepage (or other pages) into good-looking, rich and well-structured posts, when it is being shared on Facebook and other social media. For example, adding the following code snippet into HTML <head> tag will help to represent this web page correctly in social networks: