Report Summary

  • 0

    Performance

  • 0

    Accessibility

  • 0

    Best Practices

  • 0

    SEO

research.sharebuilder.com

Overview - Stock Market Research | CapitalOneInvesting.com

Page Load Speed

6.3 sec in total

First Response

245 ms

Resources Loaded

5.9 sec

Page Rendered

186 ms

research.sharebuilder.com screenshot

About Website

Welcome to research.sharebuilder.com homepage info - get ready to check Research Sharebuilder best content for United States right away, or after learning these important things about research.sharebuilder.com

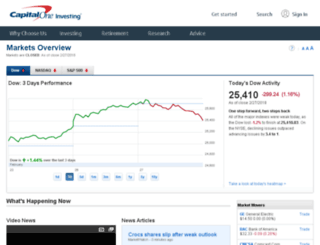
Access to investment research tools, market news, stock quotes, interactive stock screeners and robust charts on stocks, ETFs and mutual funds.

Visit research.sharebuilder.com

Key Findings

We analyzed Research.sharebuilder.com page load time and found that the first response time was 245 ms and then it took 6.1 sec to load all DOM resources and completely render a web page. This is a poor result, as 75% of websites can load faster.

Performance Metrics

research.sharebuilder.com performance score

0

Network Requests Diagram

research.capitaloneinvesting.com

245 ms

overview

374 ms

$amtxgYWAfQ2.css

136 ms

$amtxgYWAfQ2.css

271 ms

wsod.css

104 ms

Our browser made a total of 39 requests to load all elements on the main page. We found that 0% of them (0 request) were addressed to the original Research.sharebuilder.com, 10% (4 requests) were made to Static.capitaloneinvesting.com and 8% (3 requests) were made to Service.maxymiser.net. The less responsive or slowest element that took the longest time to load (1.6 sec) relates to the external source Service.maxymiser.net.

Page Optimization Overview & Recommendations

Page size can be reduced by 684.1 kB (70%)

Content Size

979.3 kB

After Optimization

295.2 kB

In fact, the total size of Research.sharebuilder.com main page is 979.3 kB. This result falls beyond the top 1M of websites and identifies a large and not optimized web page that may take ages to load. 25% of websites need less resources to load. Javascripts take 526.9 kB which makes up the majority of the site volume.

HTML Optimization

-78%

Potential reduce by 58.1 kB

  • Original 74.7 kB
  • After minification 73.9 kB
  • After compression 16.6 kB

HTML content can be minified and compressed by a website’s server. The most efficient way is to compress content using GZIP which reduces data amount travelling through the network between server and browser. HTML code on this page is well minified. It is highly recommended that content of this web page should be compressed using GZIP, as it can save up to 58.1 kB or 78% of the original size.

Image Optimization

-50%

Potential reduce by 144.6 kB

  • Original 287.1 kB
  • After minification 142.6 kB

Image size optimization can help to speed up a website loading time. The chart above shows the difference between the size before and after optimization. Obviously, Research Sharebuilder needs image optimization as it can save up to 144.6 kB or 50% of the original volume. The most popular and efficient tools for JPEG and PNG image optimization are Jpegoptim and PNG Crush.

JavaScript Optimization

-77%

Potential reduce by 404.0 kB

  • Original 526.9 kB
  • After minification 434.1 kB
  • After compression 122.9 kB

It’s better to minify JavaScript in order to improve website performance. The diagram shows the current total size of all JavaScript files against the prospective JavaScript size after its minification and compression. It is highly recommended that all JavaScript files should be compressed and minified as it can save up to 404.0 kB or 77% of the original size.

CSS Optimization

-85%

Potential reduce by 77.4 kB

  • Original 90.6 kB
  • After minification 90.5 kB
  • After compression 13.2 kB

CSS files minification is very important to reduce a web page rendering time. The faster CSS files can load, the earlier a page can be rendered. Research.sharebuilder.com needs all CSS files to be minified and compressed as it can save up to 77.4 kB or 85% of the original size.

Requests Breakdown

Number of requests can be reduced by 10 (29%)

Requests Now

34

After Optimization

24

The browser has sent 34 CSS, Javascripts, AJAX and image requests in order to completely render the main page of Research Sharebuilder. We recommend that multiple CSS and JavaScript files should be merged into one by each type, as it can help reduce assets requests from 11 to 1 for JavaScripts and as a result speed up the page load time.

SEO Factors

research.sharebuilder.com SEO score

0

Language and Encoding

  • Language Detected

    EN

  • Language Claimed

    EN

  • Encoding

    UTF-8

Language claimed in HTML meta tag should match the language actually used on the web page. Otherwise Research.sharebuilder.com can be misinterpreted by Google and other search engines. Our service has detected that English is used on the page, and it matches the claimed language. Our system also found out that Research.sharebuilder.com main page’s claimed encoding is utf-8. Use of this encoding format is the best practice as the main page visitors from all over the world won’t have any issues with symbol transcription.

Social Sharing Optimization

Open Graph description is not detected on the main page of Research Sharebuilder. Lack of Open Graph description can be counter-productive for their social media presence, as such a description allows converting a website homepage (or other pages) into good-looking, rich and well-structured posts, when it is being shared on Facebook and other social media. For example, adding the following code snippet into HTML <head> tag will help to represent this web page correctly in social networks: