Report Summary

  • 59

    Performance

    Renders faster than
    75% of other websites

  • 83

    Accessibility

    Visual factors better than
    that of 56% of websites

  • 83

    Best Practices

    More advanced features
    available than in
    56% of websites

  • 100

    SEO

    Google-friendlier than
    95% of websites

showplacewood.com

Kitchen Cabinets and Bathroom Vanities | Showplace Cabinetry

Page Load Speed

1.5 sec in total

First Response

320 ms

Resources Loaded

903 ms

Page Rendered

232 ms
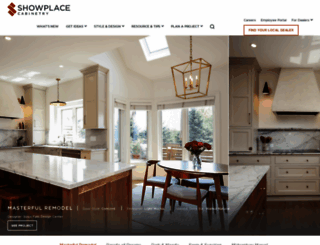
showplacewood.com screenshot

About Website

Welcome to showplacewood.com homepage info - get ready to check Showplace Wood best content for United States right away, or after learning these important things about showplacewood.com

We build high-quality, custom kitchen cabinets to match your style. Design your new kitchen or bathroom wood cabinets with Showplace/

Visit showplacewood.com

Key Findings

We analyzed Showplacewood.com page load time and found that the first response time was 320 ms and then it took 1.1 sec to load all DOM resources and completely render a web page. This is quite a good result, as only 20% of websites can load faster.

Performance Metrics

showplacewood.com performance score

59

Measured Metrics

name

value

score

weighting

FCP (First Contentful Paint)

Value2.5 s

66/100

10%

LCP (Largest Contentful Paint)

Value5.5 s

19/100

25%

SI (Speed Index)

Value5.4 s

56/100

10%

TBT (Total Blocking Time)

Value310 ms

78/100

30%

CLS (Cumulative Layout Shift)

Value0.001

100/100

15%

TTI (Time to Interactive)

Value9.0 s

34/100

10%

Network Requests Diagram

showplacewood.com

320 ms

CSSLayouts.css

64 ms

analytics.js

9 ms

collect

19 ms

splash.tile.bg.jpg

98 ms

Our browser made a total of 15 requests to load all elements on the main page. We found that 53% of them (8 requests) were addressed to the original Showplacewood.com, 13% (2 requests) were made to Google-analytics.com and 7% (1 request) were made to Stats.g.doubleclick.net. The less responsive or slowest element that took the longest time to load (530 ms) belongs to the original domain Showplacewood.com.

Page Optimization Overview & Recommendations

Page size can be reduced by 417.1 kB (52%)

Content Size

809.3 kB

After Optimization

392.2 kB

In fact, the total size of Showplacewood.com main page is 809.3 kB. This result falls beyond the top 1M of websites and identifies a large and not optimized web page that may take ages to load. 30% of websites need less resources to load. Javascripts take 431.2 kB which makes up the majority of the site volume.

HTML Optimization

-74%

Potential reduce by 93.9 kB

  • Original 127.8 kB
  • After minification 123.7 kB
  • After compression 33.8 kB

HTML content can be minified and compressed by a website’s server. The most efficient way is to compress content using GZIP which reduces data amount travelling through the network between server and browser. HTML code on this page is well minified. It is highly recommended that content of this web page should be compressed using GZIP, as it can save up to 93.9 kB or 74% of the original size.

Image Optimization

-18%

Potential reduce by 43.7 kB

  • Original 247.8 kB
  • After minification 204.1 kB

Image size optimization can help to speed up a website loading time. The chart above shows the difference between the size before and after optimization. Obviously, Showplace Wood needs image optimization as it can save up to 43.7 kB or 18% of the original volume. The most popular and efficient tools for JPEG and PNG image optimization are Jpegoptim and PNG Crush.

JavaScript Optimization

-64%

Potential reduce by 277.3 kB

  • Original 431.2 kB
  • After minification 431.2 kB
  • After compression 153.9 kB

It’s better to minify JavaScript in order to improve website performance. The diagram shows the current total size of all JavaScript files against the prospective JavaScript size after its minification and compression. It is highly recommended that all JavaScript files should be compressed and minified as it can save up to 277.3 kB or 64% of the original size.

CSS Optimization

-88%

Potential reduce by 2.2 kB

  • Original 2.5 kB
  • After minification 602 B
  • After compression 290 B

CSS files minification is very important to reduce a web page rendering time. The faster CSS files can load, the earlier a page can be rendered. Showplacewood.com needs all CSS files to be minified and compressed as it can save up to 2.2 kB or 88% of the original size.

Requests Breakdown

Number of requests can be reduced by 3 (25%)

Requests Now

12

After Optimization

9

The browser has sent 12 CSS, Javascripts, AJAX and image requests in order to completely render the main page of Showplace Wood. We recommend that multiple CSS and JavaScript files should be merged into one by each type, as it can help reduce assets requests from 4 to 1 for JavaScripts and as a result speed up the page load time.

Accessibility Review

showplacewood.com accessibility score

83

Accessibility Issues

ARIA

These are opportunities to improve the usage of ARIA in your application which may enhance the experience for users of assistive technology, like a screen reader.

Impact

Issue

High

[role] values are not valid

Contrast

These are opportunities to improve the legibility of your content.

Impact

Issue

High

Background and foreground colors do not have a sufficient contrast ratio.

Names and labels

These are opportunities to improve the semantics of the controls in your application. This may enhance the experience for users of assistive technology, like a screen reader.

Impact

Issue

High

Links do not have a discernible name

Best practices

These items highlight common accessibility best practices.

Impact

Issue

High

[user-scalable="no"] is used in the <meta name="viewport"> element or the [maximum-scale] attribute is less than 5.

Best Practices

showplacewood.com best practices score

83

Areas of Improvement

Trust and Safety

Impact

Issue

High

Does not use HTTPS

Low

Ensure CSP is effective against XSS attacks

User Experience

Impact

Issue

High

Serves images with low resolution

General

Impact

Issue

Low

Detected JavaScript libraries

High

Page has valid source maps

SEO Factors

showplacewood.com SEO score

100

Search Engine Optimization Advices

Mobile Friendly

Make sure your pages are mobile friendly so users don’t have to pinch or zoom in order to read the content pages. [Learn more](https://developers.google.com/search/mobile-sites/).

Impact

Issue

High

Document uses legible font sizes

Language and Encoding

  • Language Detected

    EN

  • Language Claimed

    N/A

  • Encoding

    UTF-8

Language claimed in HTML meta tag should match the language actually used on the web page. Otherwise Showplacewood.com can be misinterpreted by Google and other search engines. Our service has detected that English is used on the page, and neither this language nor any other was claimed in <html> or <meta> tags. Our system also found out that Showplacewood.com main page’s claimed encoding is utf-8. Use of this encoding format is the best practice as the main page visitors from all over the world won’t have any issues with symbol transcription.

Social Sharing Optimization

Open Graph description is not detected on the main page of Showplace Wood. Lack of Open Graph description can be counter-productive for their social media presence, as such a description allows converting a website homepage (or other pages) into good-looking, rich and well-structured posts, when it is being shared on Facebook and other social media. For example, adding the following code snippet into HTML <head> tag will help to represent this web page correctly in social networks: