Report Summary

  • 0

    Performance

  • 0

    Accessibility

  • 0

    Best Practices

  • 0

    SEO

smartfabricsconference.com

WEAR Conference 2017

Page Load Speed

4.2 sec in total

First Response

281 ms

Resources Loaded

3.4 sec

Page Rendered

536 ms
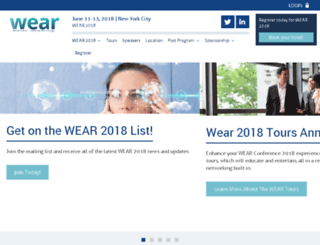
smartfabricsconference.com screenshot

About Website

Welcome to smartfabricsconference.com homepage info - get ready to check Smartfabrics Conference best content for United States right away, or after learning these important things about smartfabricsconference.com

Home of the leading WEAR Conference 2017: an event dedicated to the business of wearable technology, material innovation, smart clothing and consumer experience.

Visit smartfabricsconference.com

Key Findings

We analyzed Smartfabricsconference.com page load time and found that the first response time was 281 ms and then it took 3.9 sec to load all DOM resources and completely render a web page. This is a poor result, as 65% of websites can load faster.

Performance Metrics

smartfabricsconference.com performance score

0

Network Requests Diagram

smartfabricsconference.com

281 ms

www.wearconferences.com

1090 ms

style.css

358 ms

modernizr.js

234 ms

theme.css

414 ms

Our browser made a total of 44 requests to load all elements on the main page. We found that 2% of them (1 request) were addressed to the original Smartfabricsconference.com, 84% (37 requests) were made to Wearconferences.com and 7% (3 requests) were made to Google-analytics.com. The less responsive or slowest element that took the longest time to load (1.1 sec) relates to the external source Wearconferences.com.

Page Optimization Overview & Recommendations

Page size can be reduced by 955.0 kB (55%)

Content Size

1.7 MB

After Optimization

776.8 kB

In fact, the total size of Smartfabricsconference.com main page is 1.7 MB. This result falls beyond the top 1M of websites and identifies a large and not optimized web page that may take ages to load. 50% of websites need less resources to load. Images take 652.2 kB which makes up the majority of the site volume.

HTML Optimization

-87%

Potential reduce by 158.8 kB

  • Original 182.0 kB
  • After minification 181.6 kB
  • After compression 23.2 kB

HTML content can be minified and compressed by a website’s server. The most efficient way is to compress content using GZIP which reduces data amount travelling through the network between server and browser. HTML code on this page is well minified. It is highly recommended that content of this web page should be compressed using GZIP, as it can save up to 158.8 kB or 87% of the original size.

Image Optimization

-18%

Potential reduce by 115.8 kB

  • Original 652.2 kB
  • After minification 536.4 kB

Image size optimization can help to speed up a website loading time. The chart above shows the difference between the size before and after optimization. Obviously, Smartfabrics Conference needs image optimization as it can save up to 115.8 kB or 18% of the original volume. The most popular and efficient tools for JPEG and PNG image optimization are Jpegoptim and PNG Crush.

JavaScript Optimization

-68%

Potential reduce by 319.3 kB

  • Original 469.9 kB
  • After minification 452.0 kB
  • After compression 150.6 kB

It’s better to minify JavaScript in order to improve website performance. The diagram shows the current total size of all JavaScript files against the prospective JavaScript size after its minification and compression. It is highly recommended that all JavaScript files should be compressed and minified as it can save up to 319.3 kB or 68% of the original size.

CSS Optimization

-84%

Potential reduce by 361.0 kB

  • Original 427.7 kB
  • After minification 407.0 kB
  • After compression 66.7 kB

CSS files minification is very important to reduce a web page rendering time. The faster CSS files can load, the earlier a page can be rendered. Smartfabricsconference.com needs all CSS files to be minified and compressed as it can save up to 361.0 kB or 84% of the original size.

Requests Breakdown

Number of requests can be reduced by 14 (42%)

Requests Now

33

After Optimization

19

The browser has sent 33 CSS, Javascripts, AJAX and image requests in order to completely render the main page of Smartfabrics Conference. We recommend that multiple CSS and JavaScript files should be merged into one by each type, as it can help reduce assets requests from 15 to 1 for JavaScripts and as a result speed up the page load time.

SEO Factors

smartfabricsconference.com SEO score

0

Language and Encoding

  • Language Detected

    EN

  • Language Claimed

    N/A

  • Encoding

    UTF-8

Language claimed in HTML meta tag should match the language actually used on the web page. Otherwise Smartfabricsconference.com can be misinterpreted by Google and other search engines. Our service has detected that English is used on the page, and neither this language nor any other was claimed in <html> or <meta> tags. Our system also found out that Smartfabricsconference.com main page’s claimed encoding is utf-8. Use of this encoding format is the best practice as the main page visitors from all over the world won’t have any issues with symbol transcription.

Social Sharing Optimization

Open Graph description is not detected on the main page of Smartfabrics Conference. Lack of Open Graph description can be counter-productive for their social media presence, as such a description allows converting a website homepage (or other pages) into good-looking, rich and well-structured posts, when it is being shared on Facebook and other social media. For example, adding the following code snippet into HTML <head> tag will help to represent this web page correctly in social networks: