Report Summary

  • 17

    Performance

    Renders faster than
    32% of other websites

  • 91

    Accessibility

    Visual factors better than
    that of 77% of websites

  • 83

    Best Practices

    More advanced features
    available than in
    56% of websites

  • 90

    SEO

    Google-friendlier than
    68% of websites

tfc.com

TF Cornerstone

Page Load Speed

3.3 sec in total

First Response

128 ms

Resources Loaded

2.6 sec

Page Rendered

574 ms
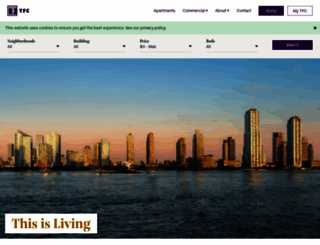
tfc.com screenshot

About Website

Click here to check amazing TF C content for United States. Otherwise, check out these important facts you probably never knew about tfc.com

TFC offers No Fee NYC Luxury Apartments; LIC No Fee Apts for Rent; Doorman Buildings in Manhattan & Long Island City, New York.

Visit tfc.com

Key Findings

We analyzed Tfc.com page load time and found that the first response time was 128 ms and then it took 3.2 sec to load all DOM resources and completely render a web page. This is a poor result, as 55% of websites can load faster.

Performance Metrics

tfc.com performance score

17

Measured Metrics

name

value

score

weighting

FCP (First Contentful Paint)

Value6.0 s

4/100

10%

LCP (Largest Contentful Paint)

Value16.7 s

0/100

25%

SI (Speed Index)

Value12.3 s

3/100

10%

TBT (Total Blocking Time)

Value2,970 ms

3/100

30%

CLS (Cumulative Layout Shift)

Value0.025

100/100

15%

TTI (Time to Interactive)

Value19.7 s

2/100

10%

Network Requests Diagram

tfc.com

128 ms

css_791YXBaKKm1ORM_7huSKEsIV9tSWq6wmRkERhuXpN6w.css

110 ms

css_dcy2FW--lCsQdoBsRmMSiXIbc54-noGwKKogLK9X9Bo.css

121 ms

css_bSIxrvmThS6WiUsUnsZ_BibMoXbsJc-aVh09IxS4gcA.css

123 ms

css_AFNnEjvDR5CvJkNKTljzBrlXpHTR2BYWPNnWbH1OEx4.css

123 ms

Our browser made a total of 95 requests to load all elements on the main page. We found that 53% of them (50 requests) were addressed to the original Tfc.com, 4% (4 requests) were made to Magnetic.t.domdex.com and 3% (3 requests) were made to Connect.facebook.net. The less responsive or slowest element that took the longest time to load (2.3 sec) belongs to the original domain Tfc.com.

Page Optimization Overview & Recommendations

Page size can be reduced by 1.0 MB (6%)

Content Size

17.1 MB

After Optimization

16.0 MB

In fact, the total size of Tfc.com main page is 17.1 MB. This result falls beyond the top 1M of websites and identifies a large and not optimized web page that may take ages to load. 60% of websites need less resources to load. Images take 15.8 MB which makes up the majority of the site volume.

HTML Optimization

-80%

Potential reduce by 61.5 kB

  • Original 77.0 kB
  • After minification 74.5 kB
  • After compression 15.6 kB

HTML content can be minified and compressed by a website’s server. The most efficient way is to compress content using GZIP which reduces data amount travelling through the network between server and browser. HTML code on this page is well minified. It is highly recommended that content of this web page should be compressed using GZIP, as it can save up to 61.5 kB or 80% of the original size.

Image Optimization

-0%

Potential reduce by 38.6 kB

  • Original 15.8 MB
  • After minification 15.7 MB

Image size optimization can help to speed up a website loading time. The chart above shows the difference between the size before and after optimization. TF C images are well optimized though.

JavaScript Optimization

-72%

Potential reduce by 589.0 kB

  • Original 815.4 kB
  • After minification 584.6 kB
  • After compression 226.5 kB

It’s better to minify JavaScript in order to improve website performance. The diagram shows the current total size of all JavaScript files against the prospective JavaScript size after its minification and compression. It is highly recommended that all JavaScript files should be compressed and minified as it can save up to 589.0 kB or 72% of the original size.

CSS Optimization

-84%

Potential reduce by 333.1 kB

  • Original 394.3 kB
  • After minification 388.4 kB
  • After compression 61.3 kB

CSS files minification is very important to reduce a web page rendering time. The faster CSS files can load, the earlier a page can be rendered. Tfc.com needs all CSS files to be minified and compressed as it can save up to 333.1 kB or 84% of the original size.

Requests Breakdown

Number of requests can be reduced by 47 (55%)

Requests Now

85

After Optimization

38

The browser has sent 85 CSS, Javascripts, AJAX and image requests in order to completely render the main page of TF C. We recommend that multiple CSS and JavaScript files should be merged into one by each type, as it can help reduce assets requests from 21 to 1 for JavaScripts and from 5 to 1 for CSS and as a result speed up the page load time.

Accessibility Review

tfc.com accessibility score

91

Accessibility Issues

ARIA

These are opportunities to improve the usage of ARIA in your application which may enhance the experience for users of assistive technology, like a screen reader.

Impact

Issue

High

[aria-*] attributes do not match their roles

High

[aria-hidden="true"] elements contain focusable descendents

Best Practices

tfc.com best practices score

83

Areas of Improvement

Trust and Safety

Impact

Issue

High

Does not use HTTPS

Low

Ensure CSP is effective against XSS attacks

User Experience

Impact

Issue

High

Serves images with low resolution

General

Impact

Issue

Low

Detected JavaScript libraries

High

Missing source maps for large first-party JavaScript

SEO Factors

tfc.com SEO score

90

Search Engine Optimization Advices

Crawling and Indexing

To appear in search results, crawlers need access to your app.

Impact

Issue

High

robots.txt is not valid

Mobile Friendly

Make sure your pages are mobile friendly so users don’t have to pinch or zoom in order to read the content pages. [Learn more](https://developers.google.com/search/mobile-sites/).

Impact

Issue

High

Document uses legible font sizes

High

Tap targets are not sized appropriately

Language and Encoding

  • Language Detected

    N/A

  • Language Claimed

    N/A

  • Encoding

    UTF-8

Language claimed in HTML meta tag should match the language actually used on the web page. Otherwise Tfc.com can be misinterpreted by Google and other search engines. Unfortunately we cannot identify language used on the page (probably there is a mix of languages, too little text or something else) and no language is claimed in <html> or <meta> tags either. Our system also found out that Tfc.com main page’s claimed encoding is utf-8. Use of this encoding format is the best practice as the main page visitors from all over the world won’t have any issues with symbol transcription.

Social Sharing Optimization

Open Graph description is not detected on the main page of TF C. Lack of Open Graph description can be counter-productive for their social media presence, as such a description allows converting a website homepage (or other pages) into good-looking, rich and well-structured posts, when it is being shared on Facebook and other social media. For example, adding the following code snippet into HTML <head> tag will help to represent this web page correctly in social networks: