Report Summary

  • 60

    Performance

    Renders faster than
    76% of other websites

  • 76

    Accessibility

    Visual factors better than
    that of 43% of websites

  • 92

    Best Practices

    More advanced features
    available than in
    81% of websites

  • 82

    SEO

    Google-friendlier than
    44% of websites

tidemark.com

Tidemark - Financial & Operational Planning Software - insightsoftware

Page Load Speed

3.9 sec in total

First Response

82 ms

Resources Loaded

2.3 sec

Page Rendered

1.5 sec
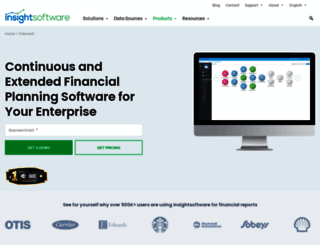
tidemark.com screenshot

About Website

Visit tidemark.com now to see the best up-to-date Tidemark content for United States and also check out these interesting facts you probably never knew about tidemark.com

Tidemark is a flexible financial planning software for workflow management that allows you to save time and improve collaboration across the organization.

Visit tidemark.com

Key Findings

We analyzed Tidemark.com page load time and found that the first response time was 82 ms and then it took 3.8 sec to load all DOM resources and completely render a web page. This is a poor result, as 60% of websites can load faster.

Performance Metrics

tidemark.com performance score

60

Measured Metrics

name

value

score

weighting

FCP (First Contentful Paint)

Value2.8 s

57/100

10%

LCP (Largest Contentful Paint)

Value2.9 s

81/100

25%

SI (Speed Index)

Value4.1 s

78/100

10%

TBT (Total Blocking Time)

Value850 ms

33/100

30%

CLS (Cumulative Layout Shift)

Value0.005

100/100

15%

TTI (Time to Interactive)

Value12.0 s

16/100

10%

Network Requests Diagram

tidemark.com

82 ms

HjeoqMXBearFy18yxoydBwzu0cz5mEp9gs4pnWz5BBMfeCt2fFHN4UJLFRbh52jhWD9XZR88ZAByZQsKwesRF2bk5e9uwRSkZsT1ie8qZAuyScC0jhNlOYiaikoX-As8dABk-koRdhXCdeNRjAUGdaFXOY4ojAtljhyydKukiY8hO1FUiABkZWF3jAF8OcFzdP37O14ojAtljhyydKukiY8hO1FUiABkZWF3jAF8OcFzdPJwSY4zpe8ljPu0daZyJ68ciWsuScIlSYb7fbKnMsMMeMI6MKG4fH3gIMMjfkMfH6qJtKGbMg62JMJ7fbRRHyMMeMX6MKG4fHvgIMMjgfMfH6qJCMIbMg65JMJ7f6K3UMIbMg6BJMJ7f6KUUMIbMg6VJMJ7fbKlMsMMeMj6MKG4fHtgIMMjIfMfH6qJK3IbMg6YJMJ7fbKwMsMMegI6MKG4fHqgIMMjffMfH6qJ76IbMg6PJMJ7fbK4MsMMeMq6MKG4fJGgIMMjIkMfH6qJy89bMs62JMJ7fbK2msMgeMX6MKG4fJsmIMIjgfMfH6qJym9bMs65JMJ7fbRxmgMgeM96MKG4fJgmIMIj2kMfH6qJ6m9bMs6YJMJ7fbKfmsMgegI6MKG4fJimIMIjffMfH6qJKB9bMs6PJMHbMZxUcOjB.js

70 ms

css

39 ms

jquery-2.1.3.min.js

47 ms

addthis_widget.js

33 ms

Our browser made a total of 98 requests to load all elements on the main page. We found that 3% of them (3 requests) were addressed to the original Tidemark.com, 44% (43 requests) were made to Static1.squarespace.com and 29% (28 requests) were made to Use.typekit.net. The less responsive or slowest element that took the longest time to load (1.2 sec) relates to the external source Use.typekit.net.

Page Optimization Overview & Recommendations

Page size can be reduced by 1.1 MB (18%)

Content Size

6.0 MB

After Optimization

4.9 MB

In fact, the total size of Tidemark.com main page is 6.0 MB. This result falls beyond the top 1M of websites and identifies a large and not optimized web page that may take ages to load. 85% of websites need less resources to load and that’s why Accessify’s recommendations for optimization and resource minification can be helpful for this project. Images take 5.1 MB which makes up the majority of the site volume.

HTML Optimization

-81%

Potential reduce by 227.8 kB

  • Original 279.5 kB
  • After minification 257.3 kB
  • After compression 51.8 kB

HTML content can be minified and compressed by a website’s server. The most efficient way is to compress content using GZIP which reduces data amount travelling through the network between server and browser. HTML code on this page is well minified. It is highly recommended that content of this web page should be compressed using GZIP, as it can save up to 227.8 kB or 81% of the original size.

Image Optimization

-9%

Potential reduce by 460.7 kB

  • Original 5.1 MB
  • After minification 4.6 MB

Image size optimization can help to speed up a website loading time. The chart above shows the difference between the size before and after optimization. Tidemark images are well optimized though.

JavaScript Optimization

-66%

Potential reduce by 413.0 kB

  • Original 625.7 kB
  • After minification 625.7 kB
  • After compression 212.7 kB

It’s better to minify JavaScript in order to improve website performance. The diagram shows the current total size of all JavaScript files against the prospective JavaScript size after its minification and compression. It is highly recommended that all JavaScript files should be compressed and minified as it can save up to 413.0 kB or 66% of the original size.

Requests Breakdown

Number of requests can be reduced by 14 (22%)

Requests Now

64

After Optimization

50

The browser has sent 64 CSS, Javascripts, AJAX and image requests in order to completely render the main page of Tidemark. We recommend that multiple CSS and JavaScript files should be merged into one by each type, as it can help reduce assets requests from 12 to 1 for JavaScripts and from 4 to 1 for CSS and as a result speed up the page load time.

Accessibility Review

tidemark.com accessibility score

76

Accessibility Issues

Names and labels

These are opportunities to improve the semantics of the controls in your application. This may enhance the experience for users of assistive technology, like a screen reader.

Impact

Issue

High

Buttons do not have an accessible name

High

Image elements do not have [alt] attributes

High

Form elements do not have associated labels

Contrast

These are opportunities to improve the legibility of your content.

Impact

Issue

High

Background and foreground colors do not have a sufficient contrast ratio.

Navigation

These are opportunities to improve keyboard navigation in your application.

Impact

Issue

High

Heading elements are not in a sequentially-descending order

Best Practices

tidemark.com best practices score

92

Areas of Improvement

Trust and Safety

Impact

Issue

High

Does not use HTTPS

Low

Ensure CSP is effective against XSS attacks

General

Impact

Issue

Low

Detected JavaScript libraries

High

Page has valid source maps

SEO Factors

tidemark.com SEO score

82

Search Engine Optimization Advices

Crawling and Indexing

To appear in search results, crawlers need access to your app.

Impact

Issue

High

Links are not crawlable

Content Best Practices

Format your HTML in a way that enables crawlers to better understand your app’s content.

Impact

Issue

High

Image elements do not have [alt] attributes

Mobile Friendly

Make sure your pages are mobile friendly so users don’t have to pinch or zoom in order to read the content pages. [Learn more](https://developers.google.com/search/mobile-sites/).

Impact

Issue

High

Document uses legible font sizes

High

Tap targets are not sized appropriately

Language and Encoding

  • Language Detected

    EN

  • Language Claimed

    EN

  • Encoding

    UTF-8

Language claimed in HTML meta tag should match the language actually used on the web page. Otherwise Tidemark.com can be misinterpreted by Google and other search engines. Our service has detected that English is used on the page, and it matches the claimed language. Our system also found out that Tidemark.com main page’s claimed encoding is utf-8. Use of this encoding format is the best practice as the main page visitors from all over the world won’t have any issues with symbol transcription.

Social Sharing Optimization

Open Graph data is detected on the main page of Tidemark. This is the best way to make the web page social media friendly. Here is how it looks like on Facebook: