Report Summary

  • 88

    Performance

    Renders faster than
    90% of other websites

  • 93

    Accessibility

    Visual factors better than
    that of 80% of websites

  • 92

    Best Practices

    More advanced features
    available than in
    80% of websites

  • 92

    SEO

    Google-friendlier than
    74% of websites

toolstud.io

Toolstud.io calculators and converters · toolstud.io

Page Load Speed

623 ms in total

First Response

30 ms

Resources Loaded

401 ms

Page Rendered

192 ms

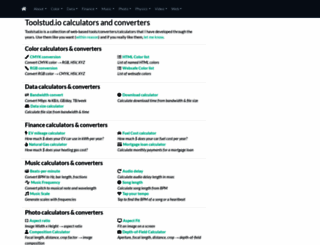
toolstud.io screenshot

About Website

Visit toolstud.io now to see the best up-to-date Toolstud content for United States and also check out these interesting facts you probably never knew about toolstud.io

Color conversion, bandwidth calculator, photo/video bitrate/filesize, aspect ratio/composition/dept-of-field, bpm, html charmap

Visit toolstud.io

Key Findings

We analyzed Toolstud.io page load time and found that the first response time was 30 ms and then it took 593 ms to load all DOM resources and completely render a web page. This is quite a good result, as only 10% of websites can load faster.

Performance Metrics

toolstud.io performance score

88

Measured Metrics

name

value

score

weighting

FCP (First Contentful Paint)

Value2.3 s

73/100

10%

LCP (Largest Contentful Paint)

Value2.8 s

83/100

25%

SI (Speed Index)

Value2.5 s

98/100

10%

TBT (Total Blocking Time)

Value190 ms

91/100

30%

CLS (Cumulative Layout Shift)

Value0.001

100/100

15%

TTI (Time to Interactive)

Value4.4 s

83/100

10%

Network Requests Diagram

toolstud.io

30 ms

toolstud.io

114 ms

yzBxR2_neiFc7fX20FMfqZq-3gw.js

20 ms

gppstub.js

43 ms

bootstrap.flatly.css

35 ms

Our browser made a total of 19 requests to load all elements on the main page. We found that 63% of them (12 requests) were addressed to the original Toolstud.io, 11% (2 requests) were made to The.gatekeeperconsent.com and 11% (2 requests) were made to Google-analytics.com. The less responsive or slowest element that took the longest time to load (114 ms) belongs to the original domain Toolstud.io.

Page Optimization Overview & Recommendations

Page size can be reduced by 40.3 kB (37%)

Content Size

109.2 kB

After Optimization

68.8 kB

In fact, the total size of Toolstud.io main page is 109.2 kB. This result falls beyond the top 1M of websites and identifies a large and not optimized web page that may take ages to load. 25% of websites need less resources to load. HTML takes 52.9 kB which makes up the majority of the site volume.

HTML Optimization

-75%

Potential reduce by 39.9 kB

  • Original 52.9 kB
  • After minification 52.9 kB
  • After compression 13.0 kB

HTML content can be minified and compressed by a website’s server. The most efficient way is to compress content using GZIP which reduces data amount travelling through the network between server and browser. HTML code on this page is well minified. It is highly recommended that content of this web page should be compressed using GZIP, as it can save up to 39.9 kB or 75% of the original size.

JavaScript Optimization

-1%

Potential reduce by 240 B

  • Original 46.6 kB
  • After minification 46.6 kB
  • After compression 46.4 kB

It’s better to minify JavaScript in order to improve website performance. The diagram shows the current total size of all JavaScript files against the prospective JavaScript size after its minification and compression. This website has mostly compressed JavaScripts.

CSS Optimization

-2%

Potential reduce by 212 B

  • Original 9.7 kB
  • After minification 9.7 kB
  • After compression 9.5 kB

CSS files minification is very important to reduce a web page rendering time. The faster CSS files can load, the earlier a page can be rendered. Toolstud.io has all CSS files already compressed.

Requests Breakdown

Number of requests can be reduced by 14 (82%)

Requests Now

17

After Optimization

3

The browser has sent 17 CSS, Javascripts, AJAX and image requests in order to completely render the main page of Toolstud. We recommend that multiple CSS and JavaScript files should be merged into one by each type, as it can help reduce assets requests from 11 to 1 for JavaScripts and from 5 to 1 for CSS and as a result speed up the page load time.

Accessibility Review

toolstud.io accessibility score

93

Accessibility Issues

Contrast

These are opportunities to improve the legibility of your content.

Impact

Issue

High

Background and foreground colors do not have a sufficient contrast ratio.

Navigation

These are opportunities to improve keyboard navigation in your application.

Impact

Issue

High

Heading elements are not in a sequentially-descending order

Names and labels

These are opportunities to improve the semantics of the controls in your application. This may enhance the experience for users of assistive technology, like a screen reader.

Impact

Issue

High

Links do not have a discernible name

Best Practices

toolstud.io best practices score

92

Areas of Improvement

Trust and Safety

Impact

Issue

High

Does not use HTTPS

Low

Ensure CSP is effective against XSS attacks

General

Impact

Issue

Low

Detected JavaScript libraries

High

Page has valid source maps

SEO Factors

toolstud.io SEO score

92

Search Engine Optimization Advices

Crawling and Indexing

To appear in search results, crawlers need access to your app.

Impact

Issue

High

Links are not crawlable

Mobile Friendly

Make sure your pages are mobile friendly so users don’t have to pinch or zoom in order to read the content pages. [Learn more](https://developers.google.com/search/mobile-sites/).

Impact

Issue

High

Document uses legible font sizes

Language and Encoding

  • Language Detected

    EN

  • Language Claimed

    EN

  • Encoding

    UTF-8

Language claimed in HTML meta tag should match the language actually used on the web page. Otherwise Toolstud.io can be misinterpreted by Google and other search engines. Our service has detected that English is used on the page, and it matches the claimed language. Our system also found out that Toolstud.io main page’s claimed encoding is utf-8. Use of this encoding format is the best practice as the main page visitors from all over the world won’t have any issues with symbol transcription.

Social Sharing Optimization

Open Graph description is not detected on the main page of Toolstud. Lack of Open Graph description can be counter-productive for their social media presence, as such a description allows converting a website homepage (or other pages) into good-looking, rich and well-structured posts, when it is being shared on Facebook and other social media. For example, adding the following code snippet into HTML <head> tag will help to represent this web page correctly in social networks: