Report Summary

  • 37

    Performance

    Renders faster than
    57% of other websites

  • 80

    Accessibility

    Visual factors better than
    that of 50% of websites

  • 83

    Best Practices

    More advanced features
    available than in
    56% of websites

  • 90

    SEO

    Google-friendlier than
    68% of websites

webgraphik.com

Illustrateur vectoriel / Designer graphique indépendante

Page Load Speed

9.7 sec in total

First Response

1.7 sec

Resources Loaded

6.6 sec

Page Rendered

1.4 sec
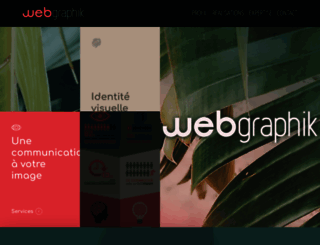
webgraphik.com screenshot

About Website

Welcome to webgraphik.com homepage info - get ready to check Webgraphik best content right away, or after learning these important things about webgraphik.com

Illustrateur / Designer graphique freelance, illustrations vectorielles, communication visuelle globale, infographie Datavisualisation, flatdesign, isométrie

Visit webgraphik.com

Key Findings

We analyzed Webgraphik.com page load time and found that the first response time was 1.7 sec and then it took 8 sec to load all DOM resources and completely render a web page. This is a poor result, as 85% of websites can load faster.

Performance Metrics

webgraphik.com performance score

37

Measured Metrics

name

value

score

weighting

FCP (First Contentful Paint)

Value6.4 s

2/100

10%

LCP (Largest Contentful Paint)

Value12.0 s

0/100

25%

SI (Speed Index)

Value12.8 s

2/100

10%

TBT (Total Blocking Time)

Value380 ms

70/100

30%

CLS (Cumulative Layout Shift)

Value0.059

98/100

15%

TTI (Time to Interactive)

Value14.8 s

8/100

10%

Network Requests Diagram

www.webgraphik.com

1727 ms

style.min.css

129 ms

portfolio.css

286 ms

style.css

325 ms

font-awesome.min.css

188 ms

Our browser made a total of 76 requests to load all elements on the main page. We found that 80% of them (61 requests) were addressed to the original Webgraphik.com, 11% (8 requests) were made to Fonts.gstatic.com and 5% (4 requests) were made to Google-analytics.com. The less responsive or slowest element that took the longest time to load (1.7 sec) belongs to the original domain Webgraphik.com.

Page Optimization Overview & Recommendations

Page size can be reduced by 105.7 kB (7%)

Content Size

1.5 MB

After Optimization

1.4 MB

In fact, the total size of Webgraphik.com main page is 1.5 MB. This result falls beyond the top 1M of websites and identifies a large and not optimized web page that may take ages to load. 80% of websites need less resources to load and that’s why Accessify’s recommendations for optimization and resource minification can be helpful for this project. Images take 993.8 kB which makes up the majority of the site volume.

HTML Optimization

-83%

Potential reduce by 49.3 kB

  • Original 59.7 kB
  • After minification 55.4 kB
  • After compression 10.3 kB

HTML content can be minified and compressed by a website’s server. The most efficient way is to compress content using GZIP which reduces data amount travelling through the network between server and browser. HTML code on this page is well minified. It is highly recommended that content of this web page should be compressed using GZIP, as it can save up to 49.3 kB or 83% of the original size.

Image Optimization

-0%

Potential reduce by 2.4 kB

  • Original 993.8 kB
  • After minification 991.4 kB

Image size optimization can help to speed up a website loading time. The chart above shows the difference between the size before and after optimization. Webgraphik images are well optimized though.

JavaScript Optimization

-15%

Potential reduce by 33.4 kB

  • Original 216.1 kB
  • After minification 216.1 kB
  • After compression 182.7 kB

It’s better to minify JavaScript in order to improve website performance. The diagram shows the current total size of all JavaScript files against the prospective JavaScript size after its minification and compression. It is highly recommended that all JavaScript files should be compressed and minified as it can save up to 33.4 kB or 15% of the original size.

CSS Optimization

-11%

Potential reduce by 20.5 kB

  • Original 194.6 kB
  • After minification 194.6 kB
  • After compression 174.0 kB

CSS files minification is very important to reduce a web page rendering time. The faster CSS files can load, the earlier a page can be rendered. Webgraphik.com needs all CSS files to be minified and compressed as it can save up to 20.5 kB or 11% of the original size.

Requests Breakdown

Number of requests can be reduced by 43 (67%)

Requests Now

64

After Optimization

21

The browser has sent 64 CSS, Javascripts, AJAX and image requests in order to completely render the main page of Webgraphik. We recommend that multiple CSS and JavaScript files should be merged into one by each type, as it can help reduce assets requests from 28 to 1 for JavaScripts and from 17 to 1 for CSS and as a result speed up the page load time.

Accessibility Review

webgraphik.com accessibility score

80

Accessibility Issues

Contrast

These are opportunities to improve the legibility of your content.

Impact

Issue

High

Background and foreground colors do not have a sufficient contrast ratio.

Navigation

These are opportunities to improve keyboard navigation in your application.

Impact

Issue

High

Heading elements are not in a sequentially-descending order

Names and labels

These are opportunities to improve the semantics of the controls in your application. This may enhance the experience for users of assistive technology, like a screen reader.

Impact

Issue

High

Links do not have a discernible name

Best practices

These items highlight common accessibility best practices.

Impact

Issue

High

[user-scalable="no"] is used in the <meta name="viewport"> element or the [maximum-scale] attribute is less than 5.

Best Practices

webgraphik.com best practices score

83

Areas of Improvement

Trust and Safety

Impact

Issue

High

Does not use HTTPS

High

Includes front-end JavaScript libraries with known security vulnerabilities

Low

Ensure CSP is effective against XSS attacks

General

Impact

Issue

Low

Detected JavaScript libraries

SEO Factors

webgraphik.com SEO score

90

Search Engine Optimization Advices

Crawling and Indexing

To appear in search results, crawlers need access to your app.

Impact

Issue

High

Links are not crawlable

Mobile Friendly

Make sure your pages are mobile friendly so users don’t have to pinch or zoom in order to read the content pages. [Learn more](https://developers.google.com/search/mobile-sites/).

Impact

Issue

High

Document uses legible font sizes

High

Tap targets are not sized appropriately

Language and Encoding

  • Language Detected

    FR

  • Language Claimed

    FR

  • Encoding

    UTF-8

Language claimed in HTML meta tag should match the language actually used on the web page. Otherwise Webgraphik.com can be misinterpreted by Google and other search engines. Our service has detected that French is used on the page, and it matches the claimed language. Our system also found out that Webgraphik.com main page’s claimed encoding is utf-8. Use of this encoding format is the best practice as the main page visitors from all over the world won’t have any issues with symbol transcription.

Social Sharing Optimization

Open Graph data is detected on the main page of Webgraphik. This is the best way to make the web page social media friendly. Here is how it looks like on Facebook: