Report Summary

  • 49

    Performance

    Renders faster than
    68% of other websites

  • 86

    Accessibility

    Visual factors better than
    that of 62% of websites

  • 92

    Best Practices

    More advanced features
    available than in
    81% of websites

  • 97

    SEO

    Google-friendlier than
    91% of websites

zgroup.si

Humanfrog - Ustvarjamo digitalno izkušnjo

Page Load Speed

3.3 sec in total

First Response

218 ms

Resources Loaded

3.1 sec

Page Rendered

70 ms
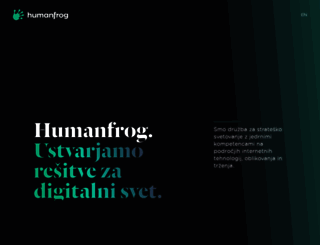
zgroup.si screenshot

About Website

Visit zgroup.si now to see the best up-to-date Zgroup content for Slovenia and also check out these interesting facts you probably never knew about zgroup.si

Humanfrog smo družba, ki strankam pomaga do uspešne spletne zgodbe. Pri tem vam pomagajo naši strokovnjaki s področja digitalizacije, internetnih tehnologij in načrtovanja izkušenj.

Visit zgroup.si

Key Findings

We analyzed Zgroup.si page load time and found that the first response time was 218 ms and then it took 3.1 sec to load all DOM resources and completely render a web page. This is a poor result, as 55% of websites can load faster.

Performance Metrics

zgroup.si performance score

49

Measured Metrics

name

value

score

weighting

FCP (First Contentful Paint)

Value6.7 s

2/100

10%

LCP (Largest Contentful Paint)

Value7.5 s

4/100

25%

SI (Speed Index)

Value10.5 s

8/100

10%

TBT (Total Blocking Time)

Value200 ms

90/100

30%

CLS (Cumulative Layout Shift)

Value0.013

100/100

15%

TTI (Time to Interactive)

Value7.2 s

50/100

10%

Network Requests Diagram

zgroup.si

218 ms

www.zgroup.si

700 ms

en

251 ms

www.humanfrog.com

923 ms

sl

154 ms

Our browser made a total of 9 requests to load all elements on the main page. We found that 33% of them (3 requests) were addressed to the original Zgroup.si, 44% (4 requests) were made to Humanfrog.com and 22% (2 requests) were made to Googletagmanager.com. The less responsive or slowest element that took the longest time to load (923 ms) relates to the external source Humanfrog.com.

Page Optimization Overview & Recommendations

Page size can be reduced by 3.4 kB (1%)

Content Size

344.8 kB

After Optimization

341.4 kB

In fact, the total size of Zgroup.si main page is 344.8 kB. This result falls within a vast category (top 1 000 000) of heavyweight, probably not optimized, and thus slow loading web pages. Only a small number of websites need less resources to load. Javascripts take 325.3 kB which makes up the majority of the site volume.

HTML Optimization

-61%

Potential reduce by 2.3 kB

  • Original 3.8 kB
  • After minification 3.7 kB
  • After compression 1.5 kB

HTML content can be minified and compressed by a website’s server. The most efficient way is to compress content using GZIP which reduces data amount travelling through the network between server and browser. HTML code on this page is well minified. It is highly recommended that content of this web page should be compressed using GZIP, as it can save up to 2.3 kB or 61% of the original size.

JavaScript Optimization

-0%

Potential reduce by 1.0 kB

  • Original 325.3 kB
  • After minification 325.3 kB
  • After compression 324.3 kB

It’s better to minify JavaScript in order to improve website performance. The diagram shows the current total size of all JavaScript files against the prospective JavaScript size after its minification and compression. This website has mostly compressed JavaScripts.

CSS Optimization

-1%

Potential reduce by 87 B

  • Original 15.7 kB
  • After minification 15.7 kB
  • After compression 15.6 kB

CSS files minification is very important to reduce a web page rendering time. The faster CSS files can load, the earlier a page can be rendered. Zgroup.si has all CSS files already compressed.

Requests Breakdown

We found no issues to fix!

Requests Now

4

After Optimization

4

The browser has sent 4 CSS, Javascripts, AJAX and image requests in order to completely render the main page of Zgroup. According to our analytics all requests are already optimized.

Accessibility Review

zgroup.si accessibility score

86

Accessibility Issues

Names and labels

These are opportunities to improve the semantics of the controls in your application. This may enhance the experience for users of assistive technology, like a screen reader.

Impact

Issue

High

Buttons do not have an accessible name

Best practices

These items highlight common accessibility best practices.

Impact

Issue

High

[user-scalable="no"] is used in the <meta name="viewport"> element or the [maximum-scale] attribute is less than 5.

Best Practices

zgroup.si best practices score

92

Areas of Improvement

Trust and Safety

Impact

Issue

High

Does not use HTTPS

Low

Ensure CSP is effective against XSS attacks

General

Impact

Issue

High

Missing source maps for large first-party JavaScript

SEO Factors

zgroup.si SEO score

97

Search Engine Optimization Advices

Mobile Friendly

Make sure your pages are mobile friendly so users don’t have to pinch or zoom in order to read the content pages. [Learn more](https://developers.google.com/search/mobile-sites/).

Impact

Issue

High

Document uses legible font sizes

High

Tap targets are not sized appropriately

Language and Encoding

  • Language Detected

    EN

  • Language Claimed

    SL

  • Encoding

    UTF-8

Language claimed in HTML meta tag should match the language actually used on the web page. Otherwise Zgroup.si can be misinterpreted by Google and other search engines. Our service has detected that English is used on the page, and it does not match the claimed Slovenian language. Our system also found out that Zgroup.si main page’s claimed encoding is utf-8. Use of this encoding format is the best practice as the main page visitors from all over the world won’t have any issues with symbol transcription.

Social Sharing Optimization

Open Graph data is detected on the main page of Zgroup. This is the best way to make the web page social media friendly. Here is how it looks like on Facebook: