Report Summary

  • 52

    Performance

    Renders faster than
    70% of other websites

  • 41

    Accessibility

    Visual factors better than
    that of 18% of websites

  • 50

    Best Practices

    More advanced features
    available than in
    18% of websites

  • 62

    SEO

    Google-friendlier than
    22% of websites

zhurengong.net

主人公网

Page Load Speed

48.6 sec in total

First Response

1.8 sec

Resources Loaded

46.2 sec

Page Rendered

628 ms
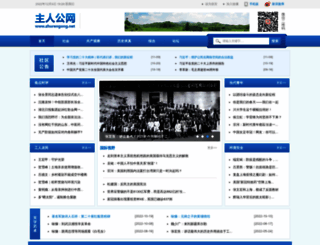
zhurengong.net screenshot

About Website

Click here to check amazing Zhurengong content for China. Otherwise, check out these important facts you probably never knew about zhurengong.net

秉持共产主义理想、社会主义方向、爱国主义情怀,是一个关注劳工大众、青年学生的生存现状,评析热点、探讨理论和思想、立场独立的民间网站。

Visit zhurengong.net

Key Findings

We analyzed Zhurengong.net page load time and found that the first response time was 1.8 sec and then it took 46.8 sec to load all DOM resources and completely render a web page. This is a poor result, as 95% of websites can load faster. Unfortunately, there were 6 request timeouts, which can generally increase the web page load time, as the browser stays idle while waiting for website response.

Performance Metrics

zhurengong.net performance score

52

Measured Metrics

name

value

score

weighting

FCP (First Contentful Paint)

Value2.3 s

74/100

10%

LCP (Largest Contentful Paint)

Value6.4 s

9/100

25%

SI (Speed Index)

Value15.5 s

0/100

10%

TBT (Total Blocking Time)

Value480 ms

60/100

30%

CLS (Cumulative Layout Shift)

Value0.004

100/100

15%

TTI (Time to Interactive)

Value3.3 s

94/100

10%

Network Requests Diagram

index.php

1815 ms

idangerous.swiper.css

4028 ms

wap.css

3925 ms

jquery.min.js

19598 ms

idangerous.swiper-2.1.min.js

19597 ms

Our browser made a total of 27 requests to load all elements on the main page. We found that 70% of them (19 requests) were addressed to the original Zhurengong.net, 4% (1 request) were made to Js.users.51.la and 4% (1 request) were made to Icon.51.la. The less responsive or slowest element that took the longest time to load (20 sec) belongs to the original domain Zhurengong.net.

Page Optimization Overview & Recommendations

Page size can be reduced by 181.5 kB (41%)

Content Size

441.8 kB

After Optimization

260.3 kB

In fact, the total size of Zhurengong.net main page is 441.8 kB. This result falls beyond the top 1M of websites and identifies a large and not optimized web page that may take ages to load. Only 5% of websites need less resources to load. Images take 241.7 kB which makes up the majority of the site volume.

HTML Optimization

-77%

Potential reduce by 126.2 kB

  • Original 164.4 kB
  • After minification 163.7 kB
  • After compression 38.2 kB

HTML content can be minified and compressed by a website’s server. The most efficient way is to compress content using GZIP which reduces data amount travelling through the network between server and browser. HTML code on this page is well minified. It is highly recommended that content of this web page should be compressed using GZIP, as it can save up to 126.2 kB or 77% of the original size.

Image Optimization

-12%

Potential reduce by 30.1 kB

  • Original 241.7 kB
  • After minification 211.5 kB

Image size optimization can help to speed up a website loading time. The chart above shows the difference between the size before and after optimization. Obviously, Zhurengong needs image optimization as it can save up to 30.1 kB or 12% of the original volume. The most popular and efficient tools for JPEG and PNG image optimization are Jpegoptim and PNG Crush.

JavaScript Optimization

-66%

Potential reduce by 15.4 kB

  • Original 23.2 kB
  • After minification 22.9 kB
  • After compression 7.8 kB

It’s better to minify JavaScript in order to improve website performance. The diagram shows the current total size of all JavaScript files against the prospective JavaScript size after its minification and compression. It is highly recommended that all JavaScript files should be compressed and minified as it can save up to 15.4 kB or 66% of the original size.

CSS Optimization

-78%

Potential reduce by 9.8 kB

  • Original 12.5 kB
  • After minification 9.7 kB
  • After compression 2.7 kB

CSS files minification is very important to reduce a web page rendering time. The faster CSS files can load, the earlier a page can be rendered. Zhurengong.net needs all CSS files to be minified and compressed as it can save up to 9.8 kB or 78% of the original size.

Requests Breakdown

Number of requests can be reduced by 3 (16%)

Requests Now

19

After Optimization

16

The browser has sent 19 CSS, Javascripts, AJAX and image requests in order to completely render the main page of Zhurengong. We recommend that multiple CSS and JavaScript files should be merged into one by each type, as it can help reduce assets requests from 4 to 1 for JavaScripts and as a result speed up the page load time.

Accessibility Review

zhurengong.net accessibility score

41

Accessibility Issues

Contrast

These are opportunities to improve the legibility of your content.

Impact

Issue

High

Background and foreground colors do not have a sufficient contrast ratio.

Internationalization and localization

These are opportunities to improve the interpretation of your content by users in different locales.

Impact

Issue

High

<html> element does not have a [lang] attribute

Names and labels

These are opportunities to improve the semantics of the controls in your application. This may enhance the experience for users of assistive technology, like a screen reader.

Impact

Issue

High

Image elements do not have [alt] attributes

High

Form elements do not have associated labels

High

Links do not have a discernible name

Tables and lists

These are opportunities to improve the experience of reading tabular or list data using assistive technology, like a screen reader.

Impact

Issue

High

Lists do not contain only <li> elements and script supporting elements (<script> and <template>).

High

List items (<li>) are not contained within <ul> or <ol> parent elements.

Best Practices

zhurengong.net best practices score

50

Areas of Improvement

Trust and Safety

Impact

Issue

High

Does not use HTTPS

High

Includes front-end JavaScript libraries with known security vulnerabilities

Low

Ensure CSP is effective against XSS attacks

User Experience

Impact

Issue

High

Displays images with incorrect aspect ratio

High

Serves images with low resolution

General

Impact

Issue

Low

Detected JavaScript libraries

High

Browser errors were logged to the console

SEO Factors

zhurengong.net SEO score

62

Search Engine Optimization Advices

Crawling and Indexing

To appear in search results, crawlers need access to your app.

Impact

Issue

High

Links are not crawlable

Content Best Practices

Format your HTML in a way that enables crawlers to better understand your app’s content.

Impact

Issue

High

Image elements do not have [alt] attributes

Language and Encoding

  • Language Detected

    ZH

  • Language Claimed

    N/A

  • Encoding

    UTF-8

Language claimed in HTML meta tag should match the language actually used on the web page. Otherwise Zhurengong.net can be misinterpreted by Google and other search engines. Our service has detected that Chinese is used on the page, and neither this language nor any other was claimed in <html> or <meta> tags. Our system also found out that Zhurengong.net main page’s claimed encoding is utf-8. Use of this encoding format is the best practice as the main page visitors from all over the world won’t have any issues with symbol transcription.

Social Sharing Optimization

Open Graph description is not detected on the main page of Zhurengong. Lack of Open Graph description can be counter-productive for their social media presence, as such a description allows converting a website homepage (or other pages) into good-looking, rich and well-structured posts, when it is being shared on Facebook and other social media. For example, adding the following code snippet into HTML <head> tag will help to represent this web page correctly in social networks: