Report Summary

  • 12

    Performance

    Renders faster than
    25% of other websites

  • 94

    Accessibility

    Visual factors better than
    that of 84% of websites

  • 83

    Best Practices

    More advanced features
    available than in
    56% of websites

  • 89

    SEO

    Google-friendlier than
    67% of websites

zinga.com

Hydraulic Oil Filtration Systems | Zinga

Page Load Speed

2.2 sec in total

First Response

711 ms

Resources Loaded

1.4 sec

Page Rendered

100 ms
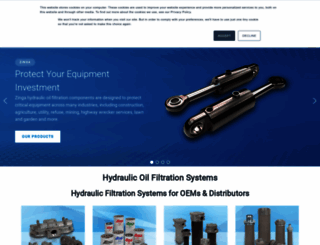
zinga.com screenshot

About Website

Click here to check amazing Zinga content for United States. Otherwise, check out these important facts you probably never knew about zinga.com

Zinga leads the industry in technologically advanced, efficient filtration solutions that improve oil cleanliness, and maximize performance. Request a Quote today!

Visit zinga.com

Key Findings

We analyzed Zinga.com page load time and found that the first response time was 711 ms and then it took 1.5 sec to load all DOM resources and completely render a web page. This is quite a good result, as only 30% of websites can load faster.

Performance Metrics

zinga.com performance score

12

Measured Metrics

name

value

score

weighting

FCP (First Contentful Paint)

Value3.9 s

24/100

10%

LCP (Largest Contentful Paint)

Value30.2 s

0/100

25%

SI (Speed Index)

Value12.9 s

2/100

10%

TBT (Total Blocking Time)

Value2,110 ms

7/100

30%

CLS (Cumulative Layout Shift)

Value0.272

45/100

15%

TTI (Time to Interactive)

Value20.8 s

2/100

10%

Network Requests Diagram

zinga.com

711 ms

menu-2b627e143a221a108573b947fd689bb4.css

42 ms

menu-responsive-2b627e143a221a108573b947fd689bb4.css

80 ms

grid-responsive.css

80 ms

bootstrap.css

83 ms

Our browser made a total of 23 requests to load all elements on the main page. We found that all of those requests were addressed to Zinga.com and no external sources were called. The less responsive or slowest element that took the longest time to load (711 ms) belongs to the original domain Zinga.com.

Page Optimization Overview & Recommendations

Page size can be reduced by 858.9 kB (76%)

Content Size

1.1 MB

After Optimization

270.7 kB

In fact, the total size of Zinga.com main page is 1.1 MB. This result falls beyond the top 1M of websites and identifies a large and not optimized web page that may take ages to load. 30% of websites need less resources to load. Images take 493.8 kB which makes up the majority of the site volume.

HTML Optimization

-83%

Potential reduce by 11.9 kB

  • Original 14.3 kB
  • After minification 9.7 kB
  • After compression 2.4 kB

HTML content can be minified and compressed by a website’s server. The most efficient way is to compress content using GZIP which reduces data amount travelling through the network between server and browser. This page needs HTML code to be minified as it can gain 4.6 kB, which is 32% of the original size. It is highly recommended that content of this web page should be compressed using GZIP, as it can save up to 11.9 kB or 83% of the original size.

Image Optimization

-80%

Potential reduce by 396.1 kB

  • Original 493.8 kB
  • After minification 97.7 kB

Image size optimization can help to speed up a website loading time. The chart above shows the difference between the size before and after optimization. Obviously, Zinga needs image optimization as it can save up to 396.1 kB or 80% of the original volume. The most popular and efficient tools for JPEG and PNG image optimization are Jpegoptim and PNG Crush.

JavaScript Optimization

-70%

Potential reduce by 326.3 kB

  • Original 468.8 kB
  • After minification 462.6 kB
  • After compression 142.5 kB

It’s better to minify JavaScript in order to improve website performance. The diagram shows the current total size of all JavaScript files against the prospective JavaScript size after its minification and compression. It is highly recommended that all JavaScript files should be compressed and minified as it can save up to 326.3 kB or 70% of the original size.

CSS Optimization

-82%

Potential reduce by 124.6 kB

  • Original 152.8 kB
  • After minification 148.7 kB
  • After compression 28.1 kB

CSS files minification is very important to reduce a web page rendering time. The faster CSS files can load, the earlier a page can be rendered. Zinga.com needs all CSS files to be minified and compressed as it can save up to 124.6 kB or 82% of the original size.

Requests Breakdown

Number of requests can be reduced by 17 (77%)

Requests Now

22

After Optimization

5

The browser has sent 22 CSS, Javascripts, AJAX and image requests in order to completely render the main page of Zinga. We recommend that multiple CSS and JavaScript files should be merged into one by each type, as it can help reduce assets requests from 12 to 1 for JavaScripts and from 7 to 1 for CSS and as a result speed up the page load time.

Accessibility Review

zinga.com accessibility score

94

Accessibility Issues

Contrast

These are opportunities to improve the legibility of your content.

Impact

Issue

High

Background and foreground colors do not have a sufficient contrast ratio.

Navigation

These are opportunities to improve keyboard navigation in your application.

Impact

Issue

High

Heading elements are not in a sequentially-descending order

Names and labels

These are opportunities to improve the semantics of the controls in your application. This may enhance the experience for users of assistive technology, like a screen reader.

Impact

Issue

High

Links do not have a discernible name

Best Practices

zinga.com best practices score

83

Areas of Improvement

Trust and Safety

Impact

Issue

High

Does not use HTTPS

Low

Ensure CSP is effective against XSS attacks

General

Impact

Issue

Low

Detected JavaScript libraries

High

Browser errors were logged to the console

High

Page has valid source maps

SEO Factors

zinga.com SEO score

89

Search Engine Optimization Advices

Mobile Friendly

Make sure your pages are mobile friendly so users don’t have to pinch or zoom in order to read the content pages. [Learn more](https://developers.google.com/search/mobile-sites/).

Impact

Issue

High

Document uses legible font sizes

High

Tap targets are not sized appropriately

Language and Encoding

  • Language Detected

    EN

  • Language Claimed

    EN

  • Encoding

    UTF-8

Language claimed in HTML meta tag should match the language actually used on the web page. Otherwise Zinga.com can be misinterpreted by Google and other search engines. Our service has detected that English is used on the page, and it matches the claimed language. Our system also found out that Zinga.com main page’s claimed encoding is utf-8. Use of this encoding format is the best practice as the main page visitors from all over the world won’t have any issues with symbol transcription.

Social Sharing Optimization

Open Graph description is not detected on the main page of Zinga. Lack of Open Graph description can be counter-productive for their social media presence, as such a description allows converting a website homepage (or other pages) into good-looking, rich and well-structured posts, when it is being shared on Facebook and other social media. For example, adding the following code snippet into HTML <head> tag will help to represent this web page correctly in social networks: