Report Summary

  • 53

    Performance

    Renders faster than
    71% of other websites

  • 90

    Accessibility

    Visual factors better than
    that of 75% of websites

  • 75

    Best Practices

    More advanced features
    available than in
    36% of websites

  • 75

    SEO

    Google-friendlier than
    32% of websites

axapro.com

Home - AXA Professionals for Technical and Healthcare Staffing

Page Load Speed

725 ms in total

First Response

118 ms

Resources Loaded

463 ms

Page Rendered

144 ms
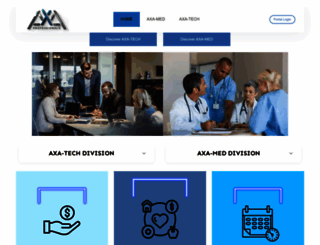
axapro.com screenshot

About Website

Click here to check amazing AXA Pro content. Otherwise, check out these important facts you probably never knew about axapro.com

A professional consulting firm for the information technology business. We offer a comprehensive management service made available to our clients on their terms, whether hourly, project-based or fully...

Visit axapro.com

Key Findings

We analyzed Axapro.com page load time and found that the first response time was 118 ms and then it took 607 ms to load all DOM resources and completely render a web page. This is quite a good result, as only 10% of websites can load faster.

Performance Metrics

axapro.com performance score

53

Measured Metrics

name

value

score

weighting

FCP (First Contentful Paint)

Value2.0 s

83/100

10%

LCP (Largest Contentful Paint)

Value33.7 s

0/100

25%

SI (Speed Index)

Value15.1 s

1/100

10%

TBT (Total Blocking Time)

Value140 ms

95/100

30%

CLS (Cumulative Layout Shift)

Value0

100/100

15%

TTI (Time to Interactive)

Value15.5 s

7/100

10%

Network Requests Diagram

axapro.com

118 ms

bootstrap.min.css

151 ms

font-awesome.css

96 ms

style.css

125 ms

style_responsive.css

142 ms

Our browser made a total of 26 requests to load all elements on the main page. We found that 73% of them (19 requests) were addressed to the original Axapro.com, 19% (5 requests) were made to Fonts.gstatic.com and 8% (2 requests) were made to Fonts.googleapis.com. The less responsive or slowest element that took the longest time to load (291 ms) belongs to the original domain Axapro.com.

Page Optimization Overview & Recommendations

Page size can be reduced by 265.4 kB (41%)

Content Size

642.5 kB

After Optimization

377.1 kB

In fact, the total size of Axapro.com main page is 642.5 kB. This result falls beyond the top 1M of websites and identifies a large and not optimized web page that may take ages to load. 35% of websites need less resources to load. Images take 299.7 kB which makes up the majority of the site volume.

HTML Optimization

-79%

Potential reduce by 12.3 kB

  • Original 15.5 kB
  • After minification 9.7 kB
  • After compression 3.2 kB

HTML content can be minified and compressed by a website’s server. The most efficient way is to compress content using GZIP which reduces data amount travelling through the network between server and browser. This page needs HTML code to be minified as it can gain 5.8 kB, which is 37% of the original size. It is highly recommended that content of this web page should be compressed using GZIP, as it can save up to 12.3 kB or 79% of the original size.

Image Optimization

-3%

Potential reduce by 7.9 kB

  • Original 299.7 kB
  • After minification 291.7 kB

Image size optimization can help to speed up a website loading time. The chart above shows the difference between the size before and after optimization. AXA Pro images are well optimized though.

JavaScript Optimization

-66%

Potential reduce by 106.3 kB

  • Original 160.6 kB
  • After minification 159.5 kB
  • After compression 54.3 kB

It’s better to minify JavaScript in order to improve website performance. The diagram shows the current total size of all JavaScript files against the prospective JavaScript size after its minification and compression. It is highly recommended that all JavaScript files should be compressed and minified as it can save up to 106.3 kB or 66% of the original size.

CSS Optimization

-83%

Potential reduce by 138.9 kB

  • Original 166.8 kB
  • After minification 151.3 kB
  • After compression 27.9 kB

CSS files minification is very important to reduce a web page rendering time. The faster CSS files can load, the earlier a page can be rendered. Axapro.com needs all CSS files to be minified and compressed as it can save up to 138.9 kB or 83% of the original size.

Requests Breakdown

Number of requests can be reduced by 12 (60%)

Requests Now

20

After Optimization

8

The browser has sent 20 CSS, Javascripts, AJAX and image requests in order to completely render the main page of AXA Pro. We recommend that multiple CSS and JavaScript files should be merged into one by each type, as it can help reduce assets requests from 5 to 1 for JavaScripts and from 9 to 1 for CSS and as a result speed up the page load time.

Accessibility Review

axapro.com accessibility score

90

Accessibility Issues

Contrast

These are opportunities to improve the legibility of your content.

Impact

Issue

High

Background and foreground colors do not have a sufficient contrast ratio.

Names and labels

These are opportunities to improve the semantics of the controls in your application. This may enhance the experience for users of assistive technology, like a screen reader.

Impact

Issue

High

Links do not have a discernible name

Tables and lists

These are opportunities to improve the experience of reading tabular or list data using assistive technology, like a screen reader.

Impact

Issue

High

Lists do not contain only <li> elements and script supporting elements (<script> and <template>).

Best Practices

axapro.com best practices score

75

Areas of Improvement

Trust and Safety

Impact

Issue

High

Does not use HTTPS

High

Includes front-end JavaScript libraries with known security vulnerabilities

Low

Ensure CSP is effective against XSS attacks

General

Impact

Issue

Low

Detected JavaScript libraries

High

Browser errors were logged to the console

SEO Factors

axapro.com SEO score

75

Search Engine Optimization Advices

Crawling and Indexing

To appear in search results, crawlers need access to your app.

Impact

Issue

High

Links are not crawlable

High

Page is blocked from indexing

Mobile Friendly

Make sure your pages are mobile friendly so users don’t have to pinch or zoom in order to read the content pages. [Learn more](https://developers.google.com/search/mobile-sites/).

Impact

Issue

High

Document uses legible font sizes

High

Tap targets are not sized appropriately

Language and Encoding

  • Language Detected

    EN

  • Language Claimed

    EN

  • Encoding

    UTF-8

Language claimed in HTML meta tag should match the language actually used on the web page. Otherwise Axapro.com can be misinterpreted by Google and other search engines. Our service has detected that English is used on the page, and it matches the claimed language. Our system also found out that Axapro.com main page’s claimed encoding is utf-8. Use of this encoding format is the best practice as the main page visitors from all over the world won’t have any issues with symbol transcription.

Social Sharing Optimization

Open Graph description is not detected on the main page of AXA Pro. Lack of Open Graph description can be counter-productive for their social media presence, as such a description allows converting a website homepage (or other pages) into good-looking, rich and well-structured posts, when it is being shared on Facebook and other social media. For example, adding the following code snippet into HTML <head> tag will help to represent this web page correctly in social networks: