45.4 sec in total
324 ms
35.1 sec
10 sec
Click here to check amazing Climate Levels content. Otherwise, check out these important facts you probably never knew about climatelevels.org
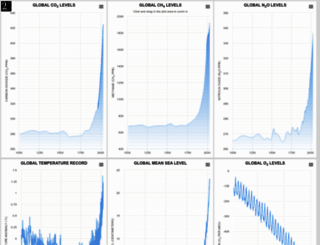
Detailed & fully interactive climate level graphs featuring current and historical greenhouse gas levels, global temperature and sea levels. Customize and embed the graph on your website or blog for f...
Visit climatelevels.orgWe analyzed Climatelevels.org page load time and found that the first response time was 324 ms and then it took 45.1 sec to load all DOM resources and completely render a web page. This is a poor result, as 95% of websites can load faster. Unfortunately, there was 1 request timeout, which can generally increase the web page load time, as the browser stays idle while waiting for website response.
climatelevels.org performance score
name
value
score
weighting
Value4.9 s
10/100
10%
Value15.5 s
0/100
25%
Value13.4 s
2/100
10%
Value4,010 ms
1/100
30%
Value0
100/100
15%
Value18.8 s
3/100
10%
324 ms
698 ms
510 ms
464 ms
1359 ms
Our browser made a total of 28 requests to load all elements on the main page. We found that 68% of them (19 requests) were addressed to the original Climatelevels.org, 11% (3 requests) were made to S7.addthis.com and 7% (2 requests) were made to Google-analytics.com. The less responsive or slowest element that took the longest time to load (12.8 sec) belongs to the original domain Climatelevels.org.
Page size can be reduced by 1.7 MB (72%)
2.4 MB
686.2 kB
In fact, the total size of Climatelevels.org main page is 2.4 MB. This result falls beyond the top 1M of websites and identifies a large and not optimized web page that may take ages to load. 65% of websites need less resources to load. HTML takes 1.3 MB which makes up the majority of the site volume.
Potential reduce by 911.3 kB
HTML content can be minified and compressed by a website’s server. The most efficient way is to compress content using GZIP which reduces data amount travelling through the network between server and browser. HTML code on this page is well minified. It is highly recommended that content of this web page should be compressed using GZIP, as it can save up to 911.3 kB or 71% of the original size.
Potential reduce by 2.0 kB
Image size optimization can help to speed up a website loading time. The chart above shows the difference between the size before and after optimization. Obviously, Climate Levels needs image optimization as it can save up to 2.0 kB or 28% of the original volume. The most popular and efficient tools for JPEG and PNG image optimization are Jpegoptim and PNG Crush.
Potential reduce by 812.1 kB
It’s better to minify JavaScript in order to improve website performance. The diagram shows the current total size of all JavaScript files against the prospective JavaScript size after its minification and compression. It is highly recommended that all JavaScript files should be compressed and minified as it can save up to 812.1 kB or 73% of the original size.
Potential reduce by 56 B
CSS files minification is very important to reduce a web page rendering time. The faster CSS files can load, the earlier a page can be rendered. Climatelevels.org needs all CSS files to be minified and compressed as it can save up to 56 B or 15% of the original size.
Number of requests can be reduced by 14 (58%)
24
10
The browser has sent 24 CSS, Javascripts, AJAX and image requests in order to completely render the main page of Climate Levels. We recommend that multiple CSS and JavaScript files should be merged into one by each type, as it can help reduce assets requests from 15 to 1 for JavaScripts and as a result speed up the page load time.
climatelevels.org
324 ms
www.climatelevels.org
698 ms
analytics.js
510 ms
co2_group.php
464 ms
ch4_group.php
1359 ms
n2o_group.php
1207 ms
temperature_group.php
1360 ms
sealevels_group.php
1207 ms
o2_group.php
1207 ms
addthis_widget.js
1184 ms
jquery.min.js
1095 ms
collect
438 ms
highcharts_group.js
658 ms
exporting_group.js
130 ms
grid-light.js
139 ms
_ate.track.config_resp
1498 ms
300lo.json
7745 ms
sh.48536d49e4da3bdba54606b4.html
905 ms
css
11698 ms
co2-style.css
863 ms
co2-daily_data.php
861 ms
n2o-daily_data.php
7341 ms
temperature-daily_data.php
9081 ms
ch4-daily_data.php
5219 ms
logo_2degrees.png
6168 ms
sealevels-daily_data.php
0 ms
layers.0ee9c4d64cf5ebc35dab.js
6020 ms
o2-daily_data.php
12838 ms
climatelevels.org accessibility score
Contrast
These are opportunities to improve the legibility of your content.
Impact
Issue
Background and foreground colors do not have a sufficient contrast ratio.
Navigation
These are opportunities to improve keyboard navigation in your application.
Impact
Issue
Heading elements are not in a sequentially-descending order
Names and labels
These are opportunities to improve the semantics of the controls in your application. This may enhance the experience for users of assistive technology, like a screen reader.
Impact
Issue
Image elements do not have [alt] attributes
Links do not have a discernible name
Best practices
These items highlight common accessibility best practices.
Impact
Issue
[user-scalable="no"] is used in the <meta name="viewport"> element or the [maximum-scale] attribute is less than 5.
climatelevels.org best practices score
Trust and Safety
Impact
Issue
Does not use HTTPS
Includes front-end JavaScript libraries with known security vulnerabilities
Ensure CSP is effective against XSS attacks
User Experience
Impact
Issue
Displays images with incorrect aspect ratio
General
Impact
Issue
Detected JavaScript libraries
Page has valid source maps
climatelevels.org SEO score
Crawling and Indexing
To appear in search results, crawlers need access to your app.
Impact
Issue
Links are not crawlable
Content Best Practices
Format your HTML in a way that enables crawlers to better understand your app’s content.
Impact
Issue
Image elements do not have [alt] attributes
Mobile Friendly
Make sure your pages are mobile friendly so users don’t have to pinch or zoom in order to read the content pages. [Learn more](https://developers.google.com/search/mobile-sites/).
Impact
Issue
Document uses legible font sizes
EN
N/A
UTF-8
Language claimed in HTML meta tag should match the language actually used on the web page. Otherwise Climatelevels.org can be misinterpreted by Google and other search engines. Our service has detected that English is used on the page, and neither this language nor any other was claimed in <html> or <meta> tags. Our system also found out that Climatelevels.org main page’s claimed encoding is utf-8. Use of this encoding format is the best practice as the main page visitors from all over the world won’t have any issues with symbol transcription.
climatelevels.org
Open Graph data is detected on the main page of Climate Levels. This is the best way to make the web page social media friendly. Here is how it looks like on Facebook: