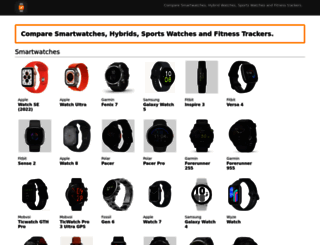
1.9 sec in total
266 ms
1 sec
593 ms
Click here to check amazing Compare Wear content for United States. Otherwise, check out these important facts you probably never knew about comparewear.com
Compare Smartwatch, Hybrid Watch, Sports Watch and Fitness Tracker essentials instantly
Visit comparewear.comWe analyzed Comparewear.com page load time and found that the first response time was 266 ms and then it took 1.6 sec to load all DOM resources and completely render a web page. This is quite a good result, as only 30% of websites can load faster.
comparewear.com performance score
name
value
score
weighting
Value4.1 s
21/100
10%
Value6.1 s
12/100
25%
Value4.3 s
76/100
10%
Value1,200 ms
20/100
30%
Value0.2
62/100
15%
Value8.3 s
39/100
10%
266 ms
67 ms
72 ms
73 ms
91 ms
Our browser made a total of 96 requests to load all elements on the main page. We found that 70% of them (67 requests) were addressed to the original Comparewear.com, 4% (4 requests) were made to Pagead2.googlesyndication.com and 4% (4 requests) were made to Tpc.googlesyndication.com. The less responsive or slowest element that took the longest time to load (330 ms) belongs to the original domain Comparewear.com.
Page size can be reduced by 328.3 kB (29%)
1.2 MB
822.8 kB
In fact, the total size of Comparewear.com main page is 1.2 MB. This result falls beyond the top 1M of websites and identifies a large and not optimized web page that may take ages to load. 70% of websites need less resources to load. Images take 911.9 kB which makes up the majority of the site volume.
Potential reduce by 68.6 kB
HTML content can be minified and compressed by a website’s server. The most efficient way is to compress content using GZIP which reduces data amount travelling through the network between server and browser. This page needs HTML code to be minified as it can gain 11.4 kB, which is 14% of the original size. It is highly recommended that content of this web page should be compressed using GZIP, as it can save up to 68.6 kB or 83% of the original size.
Potential reduce by 196.1 kB
Image size optimization can help to speed up a website loading time. The chart above shows the difference between the size before and after optimization. Obviously, Compare Wear needs image optimization as it can save up to 196.1 kB or 22% of the original volume. The most popular and efficient tools for JPEG and PNG image optimization are Jpegoptim and PNG Crush.
Potential reduce by 32.2 kB
It’s better to minify JavaScript in order to improve website performance. The diagram shows the current total size of all JavaScript files against the prospective JavaScript size after its minification and compression. It is highly recommended that all JavaScript files should be compressed and minified as it can save up to 32.2 kB or 28% of the original size.
Potential reduce by 31.5 kB
CSS files minification is very important to reduce a web page rendering time. The faster CSS files can load, the earlier a page can be rendered. Comparewear.com needs all CSS files to be minified and compressed as it can save up to 31.5 kB or 77% of the original size.
Number of requests can be reduced by 22 (24%)
91
69
The browser has sent 91 CSS, Javascripts, AJAX and image requests in order to completely render the main page of Compare Wear. We recommend that multiple CSS and JavaScript files should be merged into one by each type, as it can help reduce assets requests from 13 to 1 for JavaScripts and from 6 to 1 for CSS and as a result speed up the page load time.
comparewear.com
266 ms
style.css
67 ms
buttons.css
72 ms
sidebar.css
73 ms
index.css
91 ms
font-awesome.min.css
6 ms
css
23 ms
jquery.min.js
35 ms
adsbygoogle.js
7 ms
q
6 ms
analytics.js
195 ms
gtm.js
196 ms
getad
146 ms
json
64 ms
compare-watch.jpg
94 ms
compare-zenwatch2.jpg
95 ms
compare-qFounder.jpg
93 ms
compare-qGrant.jpg
93 ms
compare-huaweiWatch.jpg
121 ms
compare-moto360-2.jpg
259 ms
compare-modelOne.jpg
120 ms
compare-pebble.jpg
122 ms
compare-steel.jpg
120 ms
compare-time.jpg
266 ms
compare-timeRound.jpg
260 ms
compare-timeSteel.jpg
259 ms
compare-gearS.jpg
263 ms
compare-gearS2.jpg
263 ms
compare-smartwatch3.jpg
312 ms
compare-activite.jpg
313 ms
compare-activitePop.jpg
309 ms
compare-activiteSteel.jpg
315 ms
compare-peak.jpg
316 ms
compare-wsd-f10.jpg
314 ms
compare-blaze.jpg
317 ms
compare-surge.jpg
320 ms
compare-fenix3.jpg
317 ms
compare-forerunner225.jpg
320 ms
compare-vivoactive.jpg
323 ms
compare-vivoactiveHR.jpg
323 ms
compare-moto360Sport.jpg
324 ms
compare-m400.jpg
325 ms
compare-v800.jpg
327 ms
compare-spark.jpg
325 ms
compare-alta.jpg
330 ms
compare-charge.jpg
329 ms
compare-chargeHR.jpg
328 ms
compare-flex.jpg
330 ms
compare-qDreamer.jpg
330 ms
ca-pub-4031079047249681.js
137 ms
zrt_lookup.html
226 ms
show_ads_impl.js
122 ms
ODelI1aHBYDBqgeIAH2zlNzbP97U9sKh0jjxbPbfOKg.ttf
76 ms
toadOcfmlt9b38dHJxOBGMw1o1eFRj7wYC6JbISqOjY.ttf
111 ms
toadOcfmlt9b38dHJxOBGNNE-IuDiR70wI4zXaKqWCM.ttf
217 ms
fontawesome-webfont.woff
45 ms
compare-qReveler.jpg
321 ms
linkid.js
86 ms
q
173 ms
compare-vivofit.jpg
279 ms
compare-vivofit3.jpg
282 ms
compare-vivosmart.jpg
281 ms
compare-vivosmartHR.jpg
278 ms
compare-talkbandB2.jpg
255 ms
compare-up2.jpg
254 ms
compare-up3.jpg
257 ms
compare-up4.jpg
253 ms
ads
195 ms
compare-reign.jpg
120 ms
compare-band2.jpg
119 ms
compare-flash.jpg
128 ms
compare-flashCyclist.jpg
134 ms
compare-ray.jpg
159 ms
osd.js
68 ms
collect
67 ms
json
57 ms
57 ms
compare-shine2.jpg
96 ms
compare-speedoShine.jpg
100 ms
compare-now.jpg
98 ms
compare-loop2.jpg
110 ms
compare-gearFit.jpg
117 ms
compare-smartband2.jpg
132 ms
compare-smartbandTalk.jpg
153 ms
compare-one.jpg
136 ms
compare-zip.jpg
147 ms
compare-upMove.jpg
143 ms
compare-flashLink.jpg
145 ms
compare-pulse.jpg
194 ms
compare-folder.png
196 ms
13363512177748186092
42 ms
abg.js
45 ms
m_js_controller.js
56 ms
googlelogo_color_112x36dp.png
90 ms
s
33 ms
x_button_blue2.png
34 ms
comparewear.com accessibility score
Contrast
These are opportunities to improve the legibility of your content.
Impact
Issue
Background and foreground colors do not have a sufficient contrast ratio.
Internationalization and localization
These are opportunities to improve the interpretation of your content by users in different locales.
Impact
Issue
<html> element does not have a [lang] attribute
Names and labels
These are opportunities to improve the semantics of the controls in your application. This may enhance the experience for users of assistive technology, like a screen reader.
Impact
Issue
Image elements do not have [alt] attributes
Links do not have a discernible name
comparewear.com best practices score
Trust and Safety
Impact
Issue
Does not use HTTPS
Includes front-end JavaScript libraries with known security vulnerabilities
Ensure CSP is effective against XSS attacks
General
Impact
Issue
Detected JavaScript libraries
Browser errors were logged to the console
Page has valid source maps
comparewear.com SEO score
Crawling and Indexing
To appear in search results, crawlers need access to your app.
Impact
Issue
Links are not crawlable
Content Best Practices
Format your HTML in a way that enables crawlers to better understand your app’s content.
Impact
Issue
Image elements do not have [alt] attributes
Mobile Friendly
Make sure your pages are mobile friendly so users don’t have to pinch or zoom in order to read the content pages. [Learn more](https://developers.google.com/search/mobile-sites/).
Impact
Issue
Document uses legible font sizes
Tap targets are not sized appropriately
EN
N/A
UTF-8
Language claimed in HTML meta tag should match the language actually used on the web page. Otherwise Comparewear.com can be misinterpreted by Google and other search engines. Our service has detected that English is used on the page, and neither this language nor any other was claimed in <html> or <meta> tags. Our system also found out that Comparewear.com main page’s claimed encoding is utf-8. Use of this encoding format is the best practice as the main page visitors from all over the world won’t have any issues with symbol transcription.
comparewear.com
Open Graph description is not detected on the main page of Compare Wear. Lack of Open Graph description can be counter-productive for their social media presence, as such a description allows converting a website homepage (or other pages) into good-looking, rich and well-structured posts, when it is being shared on Facebook and other social media. For example, adding the following code snippet into HTML <head> tag will help to represent this web page correctly in social networks: