Report Summary

  • 26

    Performance

    Renders faster than
    46% of other websites

  • 89

    Accessibility

    Visual factors better than
    that of 72% of websites

  • 83

    Best Practices

    More advanced features
    available than in
    56% of websites

  • 92

    SEO

    Google-friendlier than
    75% of websites

fafigo.de

FAFIGO - Herrenaccessoires - Handgemacht in Deutschland | FAFIGO

Page Load Speed

7.1 sec in total

First Response

383 ms

Resources Loaded

6.4 sec

Page Rendered

390 ms
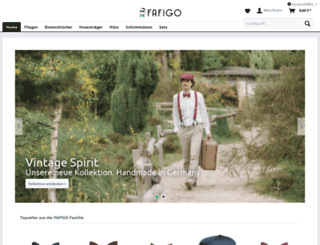
fafigo.de screenshot

About Website

Click here to check amazing FAFIGO content. Otherwise, check out these important facts you probably never knew about fafigo.de

Bei FAFIGO findest Du moderne, ausgefallene und klassische Herrenaccessoires. Einfach reinschauen, inspirieren lassen und versandkostenfrei bestellen.

Visit fafigo.de

Key Findings

We analyzed Fafigo.de page load time and found that the first response time was 383 ms and then it took 6.8 sec to load all DOM resources and completely render a web page. This is a poor result, as 80% of websites can load faster.

Performance Metrics

fafigo.de performance score

26

Measured Metrics

name

value

score

weighting

FCP (First Contentful Paint)

Value4.7 s

13/100

10%

LCP (Largest Contentful Paint)

Value14.3 s

0/100

25%

SI (Speed Index)

Value15.4 s

0/100

10%

TBT (Total Blocking Time)

Value940 ms

29/100

30%

CLS (Cumulative Layout Shift)

Value0

100/100

15%

TTI (Time to Interactive)

Value14.1 s

9/100

10%

Network Requests Diagram

fafigo.de

383 ms

fafigo.de

458 ms

www.fafigo.de

359 ms

www.fafigo.de

1234 ms

css

54 ms

Our browser made a total of 67 requests to load all elements on the main page. We found that 91% of them (61 requests) were addressed to the original Fafigo.de, 4% (3 requests) were made to Google-analytics.com and 1% (1 request) were made to Fonts.googleapis.com. The less responsive or slowest element that took the longest time to load (3.1 sec) belongs to the original domain Fafigo.de.

Page Optimization Overview & Recommendations

Page size can be reduced by 505.8 kB (24%)

Content Size

2.1 MB

After Optimization

1.6 MB

In fact, the total size of Fafigo.de main page is 2.1 MB. This result falls beyond the top 1M of websites and identifies a large and not optimized web page that may take ages to load. 30% of websites need less resources to load. Images take 1.5 MB which makes up the majority of the site volume.

HTML Optimization

-86%

Potential reduce by 49.3 kB

  • Original 57.5 kB
  • After minification 39.4 kB
  • After compression 8.2 kB

HTML content can be minified and compressed by a website’s server. The most efficient way is to compress content using GZIP which reduces data amount travelling through the network between server and browser. This page needs HTML code to be minified as it can gain 18.1 kB, which is 31% of the original size. It is highly recommended that content of this web page should be compressed using GZIP, as it can save up to 49.3 kB or 86% of the original size.

Image Optimization

-3%

Potential reduce by 46.5 kB

  • Original 1.5 MB
  • After minification 1.5 MB

Image size optimization can help to speed up a website loading time. The chart above shows the difference between the size before and after optimization. FAFIGO images are well optimized though.

JavaScript Optimization

-71%

Potential reduce by 316.9 kB

  • Original 448.5 kB
  • After minification 392.8 kB
  • After compression 131.6 kB

It’s better to minify JavaScript in order to improve website performance. The diagram shows the current total size of all JavaScript files against the prospective JavaScript size after its minification and compression. It is highly recommended that all JavaScript files should be compressed and minified as it can save up to 316.9 kB or 71% of the original size.

CSS Optimization

-84%

Potential reduce by 93.2 kB

  • Original 110.6 kB
  • After minification 79.0 kB
  • After compression 17.4 kB

CSS files minification is very important to reduce a web page rendering time. The faster CSS files can load, the earlier a page can be rendered. Fafigo.de needs all CSS files to be minified and compressed as it can save up to 93.2 kB or 84% of the original size.

Requests Breakdown

Number of requests can be reduced by 35 (56%)

Requests Now

62

After Optimization

27

The browser has sent 62 CSS, Javascripts, AJAX and image requests in order to completely render the main page of FAFIGO. We recommend that multiple CSS and JavaScript files should be merged into one by each type, as it can help reduce assets requests from 21 to 1 for JavaScripts and from 6 to 1 for CSS and as a result speed up the page load time.

Accessibility Review

fafigo.de accessibility score

89

Accessibility Issues

ARIA

These are opportunities to improve the usage of ARIA in your application which may enhance the experience for users of assistive technology, like a screen reader.

Impact

Issue

High

button, link, and menuitem elements do not have accessible names.

Contrast

These are opportunities to improve the legibility of your content.

Impact

Issue

High

Background and foreground colors do not have a sufficient contrast ratio.

Best practices

These items highlight common accessibility best practices.

Impact

Issue

High

[user-scalable="no"] is used in the <meta name="viewport"> element or the [maximum-scale] attribute is less than 5.

Best Practices

fafigo.de best practices score

83

Areas of Improvement

Trust and Safety

Impact

Issue

High

Does not use HTTPS

High

Includes front-end JavaScript libraries with known security vulnerabilities

Low

Ensure CSP is effective against XSS attacks

General

Impact

Issue

Low

Detected JavaScript libraries

High

Missing source maps for large first-party JavaScript

SEO Factors

fafigo.de SEO score

92

Search Engine Optimization Advices

Crawling and Indexing

To appear in search results, crawlers need access to your app.

Impact

Issue

High

Links are not crawlable

Mobile Friendly

Make sure your pages are mobile friendly so users don’t have to pinch or zoom in order to read the content pages. [Learn more](https://developers.google.com/search/mobile-sites/).

Impact

Issue

High

Document uses legible font sizes

High

Tap targets are not sized appropriately

Language and Encoding

  • Language Detected

    DE

  • Language Claimed

    N/A

  • Encoding

    UTF-8

Language claimed in HTML meta tag should match the language actually used on the web page. Otherwise Fafigo.de can be misinterpreted by Google and other search engines. Our service has detected that German is used on the page, and neither this language nor any other was claimed in <html> or <meta> tags. Our system also found out that Fafigo.de main page’s claimed encoding is utf-8. Use of this encoding format is the best practice as the main page visitors from all over the world won’t have any issues with symbol transcription.

Social Sharing Optimization

Open Graph description is not detected on the main page of FAFIGO. Lack of Open Graph description can be counter-productive for their social media presence, as such a description allows converting a website homepage (or other pages) into good-looking, rich and well-structured posts, when it is being shared on Facebook and other social media. For example, adding the following code snippet into HTML <head> tag will help to represent this web page correctly in social networks: