virtualcampustour.mcgill.ca
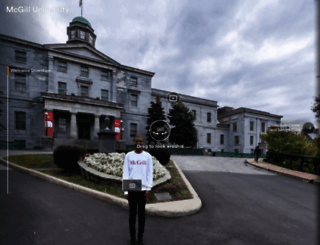
Experience McGill University in Virtual Reality.
Page Load Speed
1.1 sec in total
First Response
50 ms
Resources Loaded
831 ms
Page Rendered
220 ms
About Website
Welcome to virtualcampustour.mcgill.ca homepage info - get ready to check Virtual Campustour Mc Gill best content for Canada right away, or after learning these important things about virtualcampustour.mcgill.ca
McGill Virtual Campus Tour
Visit virtualcampustour.mcgill.caKey Findings
We analyzed Virtualcampustour.mcgill.ca page load time and found that the first response time was 50 ms and then it took 1.1 sec to load all DOM resources and completely render a web page. This is quite a good result, as only 20% of websites can load faster.