Report Summary

  • 25

    Performance

    Renders faster than
    44% of other websites

  • 85

    Accessibility

    Visual factors better than
    that of 60% of websites

  • 58

    Best Practices

    More advanced features
    available than in
    19% of websites

  • 78

    SEO

    Google-friendlier than
    40% of websites

ponicgreens.com

Hydroponics Farms In Delhi, NCR, Jaipur, Gurgaon India | Ponic Greens

Page Load Speed

9.6 sec in total

First Response

845 ms

Resources Loaded

8 sec

Page Rendered

758 ms
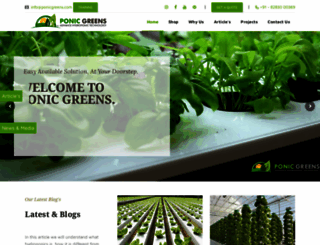
ponicgreens.com screenshot

About Website

Click here to check amazing Ponic Greens content for India. Otherwise, check out these important facts you probably never knew about ponicgreens.com

Offers Hydroponics in India by Ponic Greens which is the best Hydroponic Companies In India. Also provider of hydroponics In Delhi NCR, Jaipur, Gurgaon. We have our own hydroponic shop in Delhi NCR, J...

Visit ponicgreens.com

Key Findings

We analyzed Ponicgreens.com page load time and found that the first response time was 845 ms and then it took 8.7 sec to load all DOM resources and completely render a web page. This is a poor result, as 85% of websites can load faster.

Performance Metrics

ponicgreens.com performance score

25

Measured Metrics

name

value

score

weighting

FCP (First Contentful Paint)

Value22.9 s

0/100

10%

LCP (Largest Contentful Paint)

Value54.2 s

0/100

25%

SI (Speed Index)

Value30.5 s

0/100

10%

TBT (Total Blocking Time)

Value840 ms

34/100

30%

CLS (Cumulative Layout Shift)

Value0.016

100/100

15%

TTI (Time to Interactive)

Value38.2 s

0/100

10%

Network Requests Diagram

ponicgreens.com

845 ms

ponicgreens.com

1839 ms

gtm.js

61 ms

styles5597.css

594 ms

jquery-ui6959.css

797 ms

Our browser made a total of 122 requests to load all elements on the main page. We found that 80% of them (98 requests) were addressed to the original Ponicgreens.com, 12% (15 requests) were made to Fonts.gstatic.com and 3% (4 requests) were made to Googletagmanager.com. The less responsive or slowest element that took the longest time to load (3 sec) belongs to the original domain Ponicgreens.com.

Page Optimization Overview & Recommendations

Page size can be reduced by 3.8 MB (42%)

Content Size

9.0 MB

After Optimization

5.2 MB

In fact, the total size of Ponicgreens.com main page is 9.0 MB. This result falls beyond the top 1M of websites and identifies a large and not optimized web page that may take ages to load. 85% of websites need less resources to load and that’s why Accessify’s recommendations for optimization and resource minification can be helpful for this project. Images take 5.1 MB which makes up the majority of the site volume.

HTML Optimization

-90%

Potential reduce by 203.5 kB

  • Original 225.4 kB
  • After minification 138.7 kB
  • After compression 21.9 kB

HTML content can be minified and compressed by a website’s server. The most efficient way is to compress content using GZIP which reduces data amount travelling through the network between server and browser. This page needs HTML code to be minified as it can gain 86.7 kB, which is 38% of the original size. It is highly recommended that content of this web page should be compressed using GZIP, as it can save up to 203.5 kB or 90% of the original size.

Image Optimization

-10%

Potential reduce by 525.5 kB

  • Original 5.1 MB
  • After minification 4.5 MB

Image size optimization can help to speed up a website loading time. The chart above shows the difference between the size before and after optimization. Ponic Greens images are well optimized though.

JavaScript Optimization

-71%

Potential reduce by 863.6 kB

  • Original 1.2 MB
  • After minification 1.2 MB
  • After compression 346.7 kB

It’s better to minify JavaScript in order to improve website performance. The diagram shows the current total size of all JavaScript files against the prospective JavaScript size after its minification and compression. It is highly recommended that all JavaScript files should be compressed and minified as it can save up to 863.6 kB or 71% of the original size.

CSS Optimization

-88%

Potential reduce by 2.2 MB

  • Original 2.5 MB
  • After minification 2.3 MB
  • After compression 309.8 kB

CSS files minification is very important to reduce a web page rendering time. The faster CSS files can load, the earlier a page can be rendered. Ponicgreens.com needs all CSS files to be minified and compressed as it can save up to 2.2 MB or 88% of the original size.

Requests Breakdown

Number of requests can be reduced by 46 (46%)

Requests Now

100

After Optimization

54

The browser has sent 100 CSS, Javascripts, AJAX and image requests in order to completely render the main page of Ponic Greens. We recommend that multiple CSS and JavaScript files should be merged into one by each type, as it can help reduce assets requests from 28 to 1 for JavaScripts and from 20 to 1 for CSS and as a result speed up the page load time.

Accessibility Review

ponicgreens.com accessibility score

85

Accessibility Issues

Contrast

These are opportunities to improve the legibility of your content.

Impact

Issue

High

Background and foreground colors do not have a sufficient contrast ratio.

Navigation

These are opportunities to improve keyboard navigation in your application.

Impact

Issue

High

Heading elements are not in a sequentially-descending order

Names and labels

These are opportunities to improve the semantics of the controls in your application. This may enhance the experience for users of assistive technology, like a screen reader.

Impact

Issue

High

Image elements do not have [alt] attributes

High

Links do not have a discernible name

Best Practices

ponicgreens.com best practices score

58

Areas of Improvement

Trust and Safety

Impact

Issue

High

Does not use HTTPS

High

Includes front-end JavaScript libraries with known security vulnerabilities

Low

Ensure CSP is effective against XSS attacks

User Experience

Impact

Issue

High

Displays images with incorrect aspect ratio

High

Serves images with low resolution

General

Impact

Issue

Low

Detected JavaScript libraries

High

Browser errors were logged to the console

SEO Factors

ponicgreens.com SEO score

78

Search Engine Optimization Advices

Content Best Practices

Format your HTML in a way that enables crawlers to better understand your app’s content.

Impact

Issue

High

Links do not have descriptive text

High

Image elements do not have [alt] attributes

Crawling and Indexing

To appear in search results, crawlers need access to your app.

Impact

Issue

High

Links are not crawlable

Mobile Friendly

Make sure your pages are mobile friendly so users don’t have to pinch or zoom in order to read the content pages. [Learn more](https://developers.google.com/search/mobile-sites/).

Impact

Issue

High

Document uses legible font sizes

High

Tap targets are not sized appropriately

Language and Encoding

  • Language Detected

    EN

  • Language Claimed

    EN

  • Encoding

    IBM866

Language claimed in HTML meta tag should match the language actually used on the web page. Otherwise Ponicgreens.com can be misinterpreted by Google and other search engines. Our service has detected that English is used on the page, and it matches the claimed language. Our system also found out that Ponicgreens.com main page’s claimed encoding is ibm866. Changing it to UTF-8 can be a good choice, as this format is commonly used for encoding all over the web and thus their visitors won’t have any troubles with symbol transcription or reading.

Social Sharing Optimization

Open Graph data is detected on the main page of Ponic Greens. This is the best way to make the web page social media friendly. Here is how it looks like on Facebook: