Report Summary

  • 79

    Performance

    Renders faster than
    86% of other websites

  • 66

    Accessibility

    Visual factors better than
    that of 31% of websites

  • 67

    Best Practices

    More advanced features
    available than in
    24% of websites

  • 67

    SEO

    Google-friendlier than
    25% of websites

tpal.net

フリー素材工房by寺腰ウェブデザイン事務所

Page Load Speed

5.9 sec in total

First Response

603 ms

Resources Loaded

5 sec

Page Rendered

220 ms
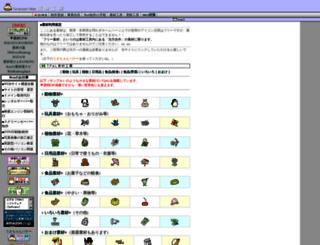
tpal.net screenshot

About Website

Visit tpal.net now to see the best up-to-date Tpal content and also check out these interesting facts you probably never knew about tpal.net

小さなフリー素材。透明GIF画像なので薄い背景色にも使えます。動物|玩具|植物|花|日用品|果物|野菜|楽器。商用利用可。

Visit tpal.net

Key Findings

We analyzed Tpal.net page load time and found that the first response time was 603 ms and then it took 5.3 sec to load all DOM resources and completely render a web page. This is a poor result, as 75% of websites can load faster.

Performance Metrics

tpal.net performance score

79

Measured Metrics

name

value

score

weighting

FCP (First Contentful Paint)

Value0.8 s

100/100

10%

LCP (Largest Contentful Paint)

Value0.9 s

100/100

25%

SI (Speed Index)

Value1.9 s

100/100

10%

TBT (Total Blocking Time)

Value910 ms

31/100

30%

CLS (Cumulative Layout Shift)

Value0.001

100/100

15%

TTI (Time to Interactive)

Value1.9 s

100/100

10%

Network Requests Diagram

tpal.net

603 ms

default.css

343 ms

b_yu88-31.gif

611 ms

b88-31.gif

528 ms

bk01.gif

668 ms

Our browser made a total of 67 requests to load all elements on the main page. We found that 99% of them (66 requests) were addressed to the original Tpal.net, 1% (1 request) were made to Tweb.jp. The less responsive or slowest element that took the longest time to load (2.4 sec) belongs to the original domain Tpal.net.

Page Optimization Overview & Recommendations

Page size can be reduced by 26.5 kB (86%)

Content Size

30.7 kB

After Optimization

4.2 kB

In fact, the total size of Tpal.net main page is 30.7 kB. This result falls beyond the top 1M of websites and identifies a large and not optimized web page that may take ages to load. Only 5% of websites need less resources to load. HTML takes 30.4 kB which makes up the majority of the site volume.

HTML Optimization

-87%

Potential reduce by 26.3 kB

  • Original 30.4 kB
  • After minification 21.6 kB
  • After compression 4.1 kB

HTML content can be minified and compressed by a website’s server. The most efficient way is to compress content using GZIP which reduces data amount travelling through the network between server and browser. This page needs HTML code to be minified as it can gain 8.8 kB, which is 29% of the original size. It is highly recommended that content of this web page should be compressed using GZIP, as it can save up to 26.3 kB or 87% of the original size.

CSS Optimization

-55%

Potential reduce by 147 B

  • Original 265 B
  • After minification 208 B
  • After compression 118 B

CSS files minification is very important to reduce a web page rendering time. The faster CSS files can load, the earlier a page can be rendered. Tpal.net needs all CSS files to be minified and compressed as it can save up to 147 B or 55% of the original size.

Requests Breakdown

Number of requests can be reduced by 51 (78%)

Requests Now

65

After Optimization

14

The browser has sent 65 CSS, Javascripts, AJAX and image requests in order to completely render the main page of Tpal. We recommend that multiple CSS and JavaScript files should be merged into one by each type, as it can help reduce assets requests and as a result speed up the page load time.

Accessibility Review

tpal.net accessibility score

66

Accessibility Issues

Internationalization and localization

These are opportunities to improve the interpretation of your content by users in different locales.

Impact

Issue

High

<html> element does not have a [lang] attribute

Names and labels

These are opportunities to improve the semantics of the controls in your application. This may enhance the experience for users of assistive technology, like a screen reader.

Impact

Issue

High

Image elements do not have [alt] attributes

Best Practices

tpal.net best practices score

67

Areas of Improvement

Trust and Safety

Impact

Issue

High

Does not use HTTPS

Low

Ensure CSP is effective against XSS attacks

User Experience

Impact

Issue

High

Serves images with low resolution

General

Impact

Issue

High

Browser errors were logged to the console

SEO Factors

tpal.net SEO score

67

Search Engine Optimization Advices

Content Best Practices

Format your HTML in a way that enables crawlers to better understand your app’s content.

Impact

Issue

High

Image elements do not have [alt] attributes

Language and Encoding

  • Language Detected

    JA

  • Language Claimed

    N/A

  • Encoding

    SHIFT_JIS

Language claimed in HTML meta tag should match the language actually used on the web page. Otherwise Tpal.net can be misinterpreted by Google and other search engines. Our service has detected that Japanese is used on the page, and neither this language nor any other was claimed in <html> or <meta> tags. Our system also found out that Tpal.net main page’s claimed encoding is shift_jis. Changing it to UTF-8 can be a good choice, as this format is commonly used for encoding all over the web and thus their visitors won’t have any troubles with symbol transcription or reading.

Social Sharing Optimization

Open Graph description is not detected on the main page of Tpal. Lack of Open Graph description can be counter-productive for their social media presence, as such a description allows converting a website homepage (or other pages) into good-looking, rich and well-structured posts, when it is being shared on Facebook and other social media. For example, adding the following code snippet into HTML <head> tag will help to represent this web page correctly in social networks: