Report Summary

  • 39

    Performance

    Renders faster than
    59% of other websites

  • 85

    Accessibility

    Visual factors better than
    that of 60% of websites

  • 92

    Best Practices

    More advanced features
    available than in
    81% of websites

  • 97

    SEO

    Google-friendlier than
    91% of websites

19blue.net

19 Blue Salon & Spa - Professional Beauty Stylists in Santa Barbara, CA

Page Load Speed

6.1 sec in total

First Response

2.7 sec

Resources Loaded

3.2 sec

Page Rendered

265 ms
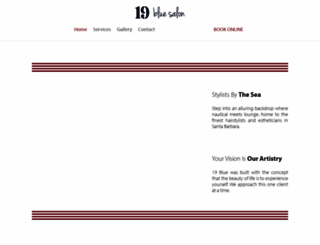
19blue.net screenshot

About Website

Visit 19blue.net now to see the best up-to-date 19 Blue content and also check out these interesting facts you probably never knew about 19blue.net

19 Blue Salon & Spa in downtown Santa Barbara. Your vision is our artistry. Call, email, or book online to schedule an appointment with a professional stylist for hair and beauty services. 19 W. Orteg...

Visit 19blue.net

Key Findings

We analyzed 19blue.net page load time and found that the first response time was 2.7 sec and then it took 3.5 sec to load all DOM resources and completely render a web page. This is a poor result, as 60% of websites can load faster.

Performance Metrics

19blue.net performance score

39

Measured Metrics

name

value

score

weighting

FCP (First Contentful Paint)

Value8.9 s

0/100

10%

LCP (Largest Contentful Paint)

Value12.3 s

0/100

25%

SI (Speed Index)

Value10.2 s

8/100

10%

TBT (Total Blocking Time)

Value120 ms

97/100

30%

CLS (Cumulative Layout Shift)

Value0.264

46/100

15%

TTI (Time to Interactive)

Value11.8 s

17/100

10%

Network Requests Diagram

19blue.net

2653 ms

sb-instagram-2-1.min.css

25 ms

style.min.css

64 ms

css

16 ms

style.css

100 ms

Our browser made a total of 30 requests to load all elements on the main page. We found that 43% of them (13 requests) were addressed to the original 19blue.net, 20% (6 requests) were made to Dev.19blue.net and 17% (5 requests) were made to Fonts.gstatic.com. The less responsive or slowest element that took the longest time to load (2.7 sec) belongs to the original domain 19blue.net.

Page Optimization Overview & Recommendations

Page size can be reduced by 1.4 MB (56%)

Content Size

2.5 MB

After Optimization

1.1 MB

In fact, the total size of 19blue.net main page is 2.5 MB. This result falls beyond the top 1M of websites and identifies a large and not optimized web page that may take ages to load. 45% of websites need less resources to load. Images take 1.1 MB which makes up the majority of the site volume.

HTML Optimization

-78%

Potential reduce by 30.1 kB

  • Original 38.7 kB
  • After minification 36.7 kB
  • After compression 8.5 kB

HTML content can be minified and compressed by a website’s server. The most efficient way is to compress content using GZIP which reduces data amount travelling through the network between server and browser. HTML code on this page is well minified. It is highly recommended that content of this web page should be compressed using GZIP, as it can save up to 30.1 kB or 78% of the original size.

Image Optimization

-20%

Potential reduce by 210.8 kB

  • Original 1.1 MB
  • After minification 841.4 kB

Image size optimization can help to speed up a website loading time. The chart above shows the difference between the size before and after optimization. Obviously, 19 Blue needs image optimization as it can save up to 210.8 kB or 20% of the original volume. The most popular and efficient tools for JPEG and PNG image optimization are Jpegoptim and PNG Crush.

JavaScript Optimization

-74%

Potential reduce by 322.7 kB

  • Original 437.0 kB
  • After minification 435.7 kB
  • After compression 114.3 kB

It’s better to minify JavaScript in order to improve website performance. The diagram shows the current total size of all JavaScript files against the prospective JavaScript size after its minification and compression. It is highly recommended that all JavaScript files should be compressed and minified as it can save up to 322.7 kB or 74% of the original size.

CSS Optimization

-86%

Potential reduce by 816.8 kB

  • Original 949.0 kB
  • After minification 948.7 kB
  • After compression 132.2 kB

CSS files minification is very important to reduce a web page rendering time. The faster CSS files can load, the earlier a page can be rendered. 19blue.net needs all CSS files to be minified and compressed as it can save up to 816.8 kB or 86% of the original size.

Requests Breakdown

Number of requests can be reduced by 12 (60%)

Requests Now

20

After Optimization

8

The browser has sent 20 CSS, Javascripts, AJAX and image requests in order to completely render the main page of 19 Blue. We recommend that multiple CSS and JavaScript files should be merged into one by each type, as it can help reduce assets requests from 6 to 1 for JavaScripts and from 8 to 1 for CSS and as a result speed up the page load time.

Accessibility Review

19blue.net accessibility score

85

Accessibility Issues

Names and labels

These are opportunities to improve the semantics of the controls in your application. This may enhance the experience for users of assistive technology, like a screen reader.

Impact

Issue

High

Links do not have a discernible name

Best practices

These items highlight common accessibility best practices.

Impact

Issue

High

[user-scalable="no"] is used in the <meta name="viewport"> element or the [maximum-scale] attribute is less than 5.

Best Practices

19blue.net best practices score

92

Areas of Improvement

Trust and Safety

Impact

Issue

High

Does not use HTTPS

Low

Ensure CSP is effective against XSS attacks

General

Impact

Issue

Low

Detected JavaScript libraries

SEO Factors

19blue.net SEO score

97

Search Engine Optimization Advices

Mobile Friendly

Make sure your pages are mobile friendly so users don’t have to pinch or zoom in order to read the content pages. [Learn more](https://developers.google.com/search/mobile-sites/).

Impact

Issue

High

Document uses legible font sizes

High

Tap targets are not sized appropriately

Language and Encoding

  • Language Detected

    EN

  • Language Claimed

    EN

  • Encoding

    UTF-8

Language claimed in HTML meta tag should match the language actually used on the web page. Otherwise 19blue.net can be misinterpreted by Google and other search engines. Our service has detected that English is used on the page, and it matches the claimed language. Our system also found out that 19blue.net main page’s claimed encoding is utf-8. Use of this encoding format is the best practice as the main page visitors from all over the world won’t have any issues with symbol transcription.

Social Sharing Optimization

Open Graph data is detected on the main page of 19 Blue. This is the best way to make the web page social media friendly. Here is how it looks like on Facebook: