825 ms in total
83 ms
675 ms
67 ms
Visit 35ewoodworks.com now to see the best up-to-date 35E Woodworks content and also check out these interesting facts you probably never knew about 35ewoodworks.com
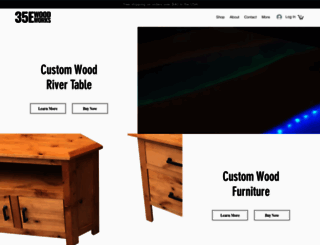
Add a touch of customization and class to your device with 35E WoodWorks custom wood phone cases. Learn More. Buy Now.
Visit 35ewoodworks.comWe analyzed 35ewoodworks.com page load time and found that the first response time was 83 ms and then it took 742 ms to load all DOM resources and completely render a web page. This is quite a good result, as only 15% of websites can load faster.
35ewoodworks.com performance score
name
value
score
weighting
Value2.8 s
57/100
10%
Value6.8 s
7/100
25%
Value6.1 s
45/100
10%
Value1,170 ms
21/100
30%
Value0.052
99/100
15%
Value12.3 s
15/100
10%
83 ms
34 ms
33 ms
75 ms
128 ms
Our browser made a total of 40 requests to load all elements on the main page. We found that 3% of them (1 request) were addressed to the original 35ewoodworks.com, 45% (18 requests) were made to Static.parastorage.com and 30% (12 requests) were made to Sentry-next.wixpress.com. The less responsive or slowest element that took the longest time to load (334 ms) relates to the external source Static.wixstatic.com.
Page size can be reduced by 554.1 kB (58%)
961.3 kB
407.2 kB
In fact, the total size of 35ewoodworks.com main page is 961.3 kB. This result falls beyond the top 1M of websites and identifies a large and not optimized web page that may take ages to load. 30% of websites need less resources to load. HTML takes 689.6 kB which makes up the majority of the site volume.
Potential reduce by 549.9 kB
HTML content can be minified and compressed by a website’s server. The most efficient way is to compress content using GZIP which reduces data amount travelling through the network between server and browser. HTML code on this page is well minified. It is highly recommended that content of this web page should be compressed using GZIP, as it can save up to 549.9 kB or 80% of the original size.
Potential reduce by 0 B
Image size optimization can help to speed up a website loading time. The chart above shows the difference between the size before and after optimization. 35E Woodworks images are well optimized though.
Potential reduce by 4.2 kB
It’s better to minify JavaScript in order to improve website performance. The diagram shows the current total size of all JavaScript files against the prospective JavaScript size after its minification and compression. This website has mostly compressed JavaScripts.
Number of requests can be reduced by 10 (48%)
21
11
The browser has sent 21 CSS, Javascripts, AJAX and image requests in order to completely render the main page of 35E Woodworks. We recommend that multiple CSS and JavaScript files should be merged into one by each type, as it can help reduce assets requests from 11 to 1 for JavaScripts and as a result speed up the page load time.
www.35ewoodworks.com
83 ms
minified.js
34 ms
focus-within-polyfill.js
33 ms
polyfill.min.js
75 ms
thunderbolt-commons.d7f857a2.bundle.min.js
128 ms
main.b6b1dfbb.bundle.min.js
125 ms
main.renderer.1d21f023.bundle.min.js
124 ms
lodash.min.js
139 ms
react.production.min.js
124 ms
react-dom.production.min.js
126 ms
siteTags.bundle.min.js
140 ms
35EWOODWORKS%2520LOGO_edited.jpg
332 ms
bundle.min.js
65 ms
a7229d_8f9fc4c891484ea19f775c9174f2a3a3f000.jpg
311 ms
a7229d_4827b98183ff4982b9fdd841f183a0b8~mv2.jpg
284 ms
a7229d_2d50578dd4fe4d6e8c32e853fdfa92a9~mv2.jpg
315 ms
a7229d_59888e26dbe8403ca9682fa8e15ac39e~mv2.jpg
334 ms
a7229d_52f058a9e2a044678038e196b86f4ac0~mv2.jpg
270 ms
114 ms
112 ms
120 ms
117 ms
108 ms
113 ms
151 ms
150 ms
158 ms
156 ms
156 ms
161 ms
e2b9cbeb-fa8e-41cd-8a6a-46044b29ba52.woff
13 ms
UC3ZEjagJi85gF9qFaBgIMITpqSvb0EhPNqvdm-qG4s.woff
6 ms
UC3ZEjagJi85gF9qFaBgIIidMZaDCgb76Cj_Fd30HHc.woff
178 ms
deprecation-en.v5.html
6 ms
bolt-performance
24 ms
deprecation-style.v5.css
8 ms
right-arrow.svg
16 ms
WixMadeforDisplay_W_Bd.woff
5 ms
WixMadeforText_W_Bd.woff
6 ms
WixMadeforText_W_Rg.woff
4 ms
35ewoodworks.com accessibility score
Navigation
These are opportunities to improve keyboard navigation in your application.
Impact
Issue
Heading elements are not in a sequentially-descending order
35ewoodworks.com best practices score
Trust and Safety
Impact
Issue
Does not use HTTPS
Ensure CSP is effective against XSS attacks
General
Impact
Issue
Detected JavaScript libraries
Browser errors were logged to the console
Page has valid source maps
35ewoodworks.com SEO score
Content Best Practices
Format your HTML in a way that enables crawlers to better understand your app’s content.
Impact
Issue
Links do not have descriptive text
Mobile Friendly
Make sure your pages are mobile friendly so users don’t have to pinch or zoom in order to read the content pages. [Learn more](https://developers.google.com/search/mobile-sites/).
Impact
Issue
Document uses legible font sizes
Tap targets are not sized appropriately
![]()
EN
![]()
EN
UTF-8
Language claimed in HTML meta tag should match the language actually used on the web page. Otherwise 35ewoodworks.com can be misinterpreted by Google and other search engines. Our service has detected that English is used on the page, and it matches the claimed language. Our system also found out that 35ewoodworks.com main page’s claimed encoding is utf-8. Use of this encoding format is the best practice as the main page visitors from all over the world won’t have any issues with symbol transcription.
35ewoodworks.com
Open Graph data is detected on the main page of PARSED_DOMAIN, but there is no image specified in description. It would be a good idea for the website admin to select a nice image that can properly represent the website in Open Graph data, otherwise the first found image will be taken for this purpose and social media information block will look like this: