Report Summary

  • 53

    Performance

    Renders faster than
    70% of other websites

  • 95

    Accessibility

    Visual factors better than
    that of 86% of websites

  • 83

    Best Practices

    More advanced features
    available than in
    55% of websites

  • 100

    SEO

    Google-friendlier than
    94% of websites

activitylog.io

Activity Log - The #1 WordPress Monitor User Changes Plugin

Page Load Speed

1.2 sec in total

First Response

86 ms

Resources Loaded

883 ms

Page Rendered

225 ms

activitylog.io screenshot

About Website

Click here to check amazing Activity Log content. Otherwise, check out these important facts you probably never knew about activitylog.io

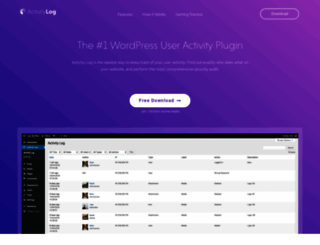
Unlock the power of your WordPress site by mastering user activity! With Activity Log plugin, you can easily see who is making moves and keep your security tight. Join over 300,000 active users!

Visit activitylog.io

Key Findings

We analyzed Activitylog.io page load time and found that the first response time was 86 ms and then it took 1.1 sec to load all DOM resources and completely render a web page. This is quite a good result, as only 25% of websites can load faster.

Performance Metrics

activitylog.io performance score

53

Measured Metrics

name

value

score

weighting

FCP (First Contentful Paint)

Value2.2 s

78/100

10%

LCP (Largest Contentful Paint)

Value4.8 s

31/100

25%

SI (Speed Index)

Value4.9 s

66/100

10%

TBT (Total Blocking Time)

Value830 ms

35/100

30%

CLS (Cumulative Layout Shift)

Value0

100/100

15%

TTI (Time to Interactive)

Value6.9 s

54/100

10%

Network Requests Diagram

activitylog.io

86 ms

activitylog.io

128 ms

frontend.min.css

93 ms

widget-image.min.css

70 ms

widget-nav-menu.min.css

110 ms

Our browser made a total of 49 requests to load all elements on the main page. We found that 71% of them (35 requests) were addressed to the original Activitylog.io, 20% (10 requests) were made to Fonts.gstatic.com and 2% (1 request) were made to Fonts.googleapis.com. The less responsive or slowest element that took the longest time to load (395 ms) belongs to the original domain Activitylog.io.

Page Optimization Overview & Recommendations

Page size can be reduced by 45.6 kB (24%)

Content Size

189.3 kB

After Optimization

143.6 kB

In fact, the total size of Activitylog.io main page is 189.3 kB. This result falls beyond the top 1M of websites and identifies a large and not optimized web page that may take ages to load. 45% of websites need less resources to load. Javascripts take 105.8 kB which makes up the majority of the site volume.

HTML Optimization

-76%

Potential reduce by 45.1 kB

  • Original 59.1 kB
  • After minification 57.4 kB
  • After compression 13.9 kB

HTML content can be minified and compressed by a website’s server. The most efficient way is to compress content using GZIP which reduces data amount travelling through the network between server and browser. HTML code on this page is well minified. It is highly recommended that content of this web page should be compressed using GZIP, as it can save up to 45.1 kB or 76% of the original size.

JavaScript Optimization

-0%

Potential reduce by 105 B

  • Original 105.8 kB
  • After minification 105.8 kB
  • After compression 105.7 kB

It’s better to minify JavaScript in order to improve website performance. The diagram shows the current total size of all JavaScript files against the prospective JavaScript size after its minification and compression. This website has mostly compressed JavaScripts.

CSS Optimization

-2%

Potential reduce by 415 B

  • Original 24.4 kB
  • After minification 24.4 kB
  • After compression 24.0 kB

CSS files minification is very important to reduce a web page rendering time. The faster CSS files can load, the earlier a page can be rendered. Activitylog.io has all CSS files already compressed.

Requests Breakdown

Number of requests can be reduced by 32 (86%)

Requests Now

37

After Optimization

5

The browser has sent 37 CSS, Javascripts, AJAX and image requests in order to completely render the main page of Activity Log. We recommend that multiple CSS and JavaScript files should be merged into one by each type, as it can help reduce assets requests from 16 to 1 for JavaScripts and from 18 to 1 for CSS and as a result speed up the page load time.

Accessibility Review

activitylog.io accessibility score

95

Accessibility Issues

Contrast

These are opportunities to improve the legibility of your content.

Impact

Issue

High

Background and foreground colors do not have a sufficient contrast ratio.

Names and labels

These are opportunities to improve the semantics of the controls in your application. This may enhance the experience for users of assistive technology, like a screen reader.

Impact

Issue

High

Links do not have a discernible name

Best Practices

activitylog.io best practices score

83

Areas of Improvement

Trust and Safety

Impact

Issue

High

Does not use HTTPS

Low

Ensure CSP is effective against XSS attacks

General

Impact

Issue

Low

Detected JavaScript libraries

High

Browser errors were logged to the console

SEO Factors

activitylog.io SEO score

100

Search Engine Optimization Advices

Mobile Friendly

Make sure your pages are mobile friendly so users don’t have to pinch or zoom in order to read the content pages. [Learn more](https://developers.google.com/search/mobile-sites/).

Impact

Issue

High

Document uses legible font sizes

Language and Encoding

  • Language Detected

    EN

  • Language Claimed

    EN

  • Encoding

    UTF-8

Language claimed in HTML meta tag should match the language actually used on the web page. Otherwise Activitylog.io can be misinterpreted by Google and other search engines. Our service has detected that English is used on the page, and it matches the claimed language. Our system also found out that Activitylog.io main page’s claimed encoding is utf-8. Use of this encoding format is the best practice as the main page visitors from all over the world won’t have any issues with symbol transcription.

Social Sharing Optimization

Open Graph data is detected on the main page of Activity Log. This is the best way to make the web page social media friendly. Here is how it looks like on Facebook: