Report Summary

  • 39

    Performance

    Renders faster than
    59% of other websites

  • 77

    Accessibility

    Visual factors better than
    that of 45% of websites

  • 83

    Best Practices

    More advanced features
    available than in
    56% of websites

  • 91

    SEO

    Google-friendlier than
    71% of websites

app.net

APP.NET - FULL SOURCE CODE PROJECT MARKETPLACE

Page Load Speed

1.3 sec in total

First Response

347 ms

Resources Loaded

830 ms

Page Rendered

114 ms
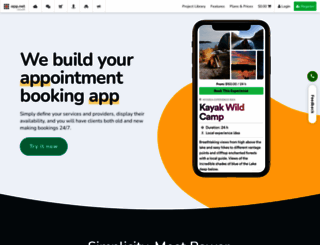
app.net screenshot

About Website

Visit app.net now to see the best up-to-date APP content for India and also check out these interesting facts you probably never knew about app.net

Full source code app marketplace. Buy full source code app outright, get free GIT repository, use our free build and deployment services to quickly release a fully functional app with a native front-e...

Visit app.net

Key Findings

We analyzed App.net page load time and found that the first response time was 347 ms and then it took 944 ms to load all DOM resources and completely render a web page. This is quite a good result, as only 15% of websites can load faster.

Performance Metrics

app.net performance score

39

Measured Metrics

name

value

score

weighting

FCP (First Contentful Paint)

Value4.6 s

13/100

10%

LCP (Largest Contentful Paint)

Value9.4 s

0/100

25%

SI (Speed Index)

Value8.1 s

21/100

10%

TBT (Total Blocking Time)

Value420 ms

65/100

30%

CLS (Cumulative Layout Shift)

Value0

100/100

15%

TTI (Time to Interactive)

Value12.8 s

13/100

10%

Network Requests Diagram

app.net

347 ms

css

87 ms

MzGVzsdR-BjjaUMRdl0R_LrTEKY.css

95 ms

pf71uAQzx-Y-QcueKcBW-Z5baGk.css

102 ms

9E7EfSjCpLES7HvyBhUGmS03j04_.js

81 ms

Our browser made a total of 14 requests to load all elements on the main page. We found that 7% of them (1 request) were addressed to the original App.net, 43% (6 requests) were made to D2c01jv13s9if1.cloudfront.net and 14% (2 requests) were made to Api.mixpanel.com. The less responsive or slowest element that took the longest time to load (347 ms) belongs to the original domain App.net.

Page Optimization Overview & Recommendations

Page size can be reduced by 693.0 kB (69%)

Content Size

1.0 MB

After Optimization

307.6 kB

In fact, the total size of App.net main page is 1.0 MB. This result falls beyond the top 1M of websites and identifies a large and not optimized web page that may take ages to load. 25% of websites need less resources to load. Javascripts take 562.7 kB which makes up the majority of the site volume.

HTML Optimization

-60%

Potential reduce by 4.9 kB

  • Original 8.1 kB
  • After minification 8.1 kB
  • After compression 3.2 kB

HTML content can be minified and compressed by a website’s server. The most efficient way is to compress content using GZIP which reduces data amount travelling through the network between server and browser. HTML code on this page is well minified. It is highly recommended that content of this web page should be compressed using GZIP, as it can save up to 4.9 kB or 60% of the original size.

Image Optimization

-2%

Potential reduce by 1.1 kB

  • Original 61.6 kB
  • After minification 60.6 kB

Image size optimization can help to speed up a website loading time. The chart above shows the difference between the size before and after optimization. APP images are well optimized though.

JavaScript Optimization

-67%

Potential reduce by 378.1 kB

  • Original 562.7 kB
  • After minification 562.7 kB
  • After compression 184.6 kB

It’s better to minify JavaScript in order to improve website performance. The diagram shows the current total size of all JavaScript files against the prospective JavaScript size after its minification and compression. It is highly recommended that all JavaScript files should be compressed and minified as it can save up to 378.1 kB or 67% of the original size.

CSS Optimization

-84%

Potential reduce by 309.0 kB

  • Original 368.2 kB
  • After minification 366.2 kB
  • After compression 59.1 kB

CSS files minification is very important to reduce a web page rendering time. The faster CSS files can load, the earlier a page can be rendered. App.net needs all CSS files to be minified and compressed as it can save up to 309.0 kB or 84% of the original size.

Requests Breakdown

Number of requests can be reduced by 4 (36%)

Requests Now

11

After Optimization

7

The browser has sent 11 CSS, Javascripts, AJAX and image requests in order to completely render the main page of APP. We recommend that multiple CSS and JavaScript files should be merged into one by each type, as it can help reduce assets requests from 5 to 1 for JavaScripts and as a result speed up the page load time.

Accessibility Review

app.net accessibility score

77

Accessibility Issues

ARIA

These are opportunities to improve the usage of ARIA in your application which may enhance the experience for users of assistive technology, like a screen reader.

Impact

Issue

High

Elements with an ARIA [role] that require children to contain a specific [role] are missing some or all of those required children.

High

[role]s are not contained by their required parent element

Contrast

These are opportunities to improve the legibility of your content.

Impact

Issue

High

Background and foreground colors do not have a sufficient contrast ratio.

Navigation

These are opportunities to improve keyboard navigation in your application.

Impact

Issue

High

Heading elements are not in a sequentially-descending order

Tables and lists

These are opportunities to improve the experience of reading tabular or list data using assistive technology, like a screen reader.

Impact

Issue

High

List items (<li>) are not contained within <ul> or <ol> parent elements.

Best practices

These items highlight common accessibility best practices.

Impact

Issue

High

[user-scalable="no"] is used in the <meta name="viewport"> element or the [maximum-scale] attribute is less than 5.

Best Practices

app.net best practices score

83

Areas of Improvement

Trust and Safety

Impact

Issue

High

Does not use HTTPS

High

Includes front-end JavaScript libraries with known security vulnerabilities

Low

Ensure CSP is effective against XSS attacks

General

Impact

Issue

Low

Detected JavaScript libraries

SEO Factors

app.net SEO score

91

Search Engine Optimization Advices

Crawling and Indexing

To appear in search results, crawlers need access to your app.

Impact

Issue

High

Links are not crawlable

Mobile Friendly

Make sure your pages are mobile friendly so users don’t have to pinch or zoom in order to read the content pages. [Learn more](https://developers.google.com/search/mobile-sites/).

Impact

Issue

High

Document uses legible font sizes

High

Tap targets are not sized appropriately

Language and Encoding

  • Language Detected

    EN

  • Language Claimed

    N/A

  • Encoding

    UTF-8

Language claimed in HTML meta tag should match the language actually used on the web page. Otherwise App.net can be misinterpreted by Google and other search engines. Our service has detected that English is used on the page, and neither this language nor any other was claimed in <html> or <meta> tags. Our system also found out that App.net main page’s claimed encoding is utf-8. Use of this encoding format is the best practice as the main page visitors from all over the world won’t have any issues with symbol transcription.

Social Sharing Optimization

Open Graph data is detected on the main page of APP. This is the best way to make the web page social media friendly. Here is how it looks like on Facebook: