2.4 sec in total
140 ms
1.9 sec
376 ms
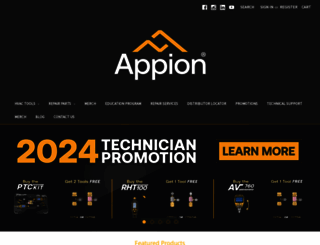
Welcome to appiontools.com homepage info - get ready to check Appion Tools best content right away, or after learning these important things about appiontools.com
Creating great products for HVAC/R technicians while continuously striving to improve the AC/R industry through innovation and education.
Visit appiontools.comWe analyzed Appiontools.com page load time and found that the first response time was 140 ms and then it took 2.3 sec to load all DOM resources and completely render a web page. This is quite a good result, as only 45% of websites can load faster.
appiontools.com performance score
name
value
score
weighting
Value2.5 s
68/100
10%
Value14.0 s
0/100
25%
Value14.7 s
1/100
10%
Value930 ms
30/100
30%
Value0.692
7/100
15%
Value24.1 s
0/100
10%
140 ms
393 ms
273 ms
70 ms
84 ms
Our browser made a total of 42 requests to load all elements on the main page. We found that 5% of them (2 requests) were addressed to the original Appiontools.com, 71% (30 requests) were made to Cdn11.bigcommerce.com and 5% (2 requests) were made to Cdn.commoninja.com. The less responsive or slowest element that took the longest time to load (1.1 sec) relates to the external source Cdn11.bigcommerce.com.
Page size can be reduced by 319.5 kB (8%)
4.0 MB
3.7 MB
In fact, the total size of Appiontools.com main page is 4.0 MB. This result falls beyond the top 1M of websites and identifies a large and not optimized web page that may take ages to load. 70% of websites need less resources to load. Images take 3.7 MB which makes up the majority of the site volume.
Potential reduce by 163.5 kB
HTML content can be minified and compressed by a website’s server. The most efficient way is to compress content using GZIP which reduces data amount travelling through the network between server and browser. HTML code on this page is well minified. It is highly recommended that content of this web page should be compressed using GZIP, as it can save up to 163.5 kB or 82% of the original size.
Potential reduce by 145.3 kB
Image size optimization can help to speed up a website loading time. The chart above shows the difference between the size before and after optimization. Appion Tools images are well optimized though.
Potential reduce by 10.8 kB
It’s better to minify JavaScript in order to improve website performance. The diagram shows the current total size of all JavaScript files against the prospective JavaScript size after its minification and compression. It is highly recommended that all JavaScript files should be compressed and minified as it can save up to 10.8 kB or 13% of the original size.
Number of requests can be reduced by 11 (28%)
39
28
The browser has sent 39 CSS, Javascripts, AJAX and image requests in order to completely render the main page of Appion Tools. We recommend that multiple CSS and JavaScript files should be merged into one by each type, as it can help reduce assets requests from 12 to 1 for JavaScripts and as a result speed up the page load time.
appiontools.com
140 ms
appiontools.com
393 ms
theme-bundle.head_async.js
273 ms
css
70 ms
theme-5bcc7b60-6d6d-013d-8450-6a35964a0e4a.css
84 ms
google_analytics4-9a468da7c21d2e9e41cd445d567f3f3a5a9b6759.js
107 ms
bodl-consent-eced236bd7d5d1675a7704c806ce0cb5b24e44fb.js
105 ms
consent-manager-config-0205627cb0b5544a157ee56e3da54f6932db237e.js
80 ms
consent-manager-08633fe15aba542118c03f6d45457262fa9fac88.js
105 ms
index.js
80 ms
commonninja.js
409 ms
getgeotrustsslseal
8 ms
theme-bundle.main.js
309 ms
csrf-protection-header-5eeddd5de78d98d146ef4fd71b2aedce4161903e.js
269 ms
js
308 ms
js
326 ms
asset_14x_1712160899__70820.original.png
127 ms
2024-winter-technician-promotion-banner-copy-min.png
150 ms
ihaci-2024-website-banner-new.png
148 ms
G5Twin-3__31145.1728943382.png
501 ms
TEZ8_01_1080__40308.1705004167.png
149 ms
SLNMAG18_1080_New__45972.1723588241.png
147 ms
PTCGKT1_New_Product_1080__37131.1723496563.png
1114 ms
PTC900_Clamp_New_Product_1__27646.1723596782.png
400 ms
RHT100_New_1080__54915.1723497231.png
174 ms
CCT516_1080__78679.1723496545.png
473 ms
CCT14_1080__98733.1723496659.png
433 ms
WS260_New_1080__55037.1723497396.png
234 ms
SPDY14_1080__03610.1707253120.png
234 ms
SPDKIT-R_MHH_1080__04102.1707255361.png
583 ms
SPDKIT-V_MHH_1080__89453.1707255324.png
759 ms
recovery-icon.png
448 ms
evacuation-icon.png
466 ms
digital-measurement-icon.png
485 ms
service-tools-icon.png
492 ms
support-components.png
503 ms
merch-icon.png
511 ms
font
144 ms
font
130 ms
icon-sprite.svg
301 ms
nobot
50 ms
main.js
31 ms
appiontools.com accessibility score
ARIA
These are opportunities to improve the usage of ARIA in your application which may enhance the experience for users of assistive technology, like a screen reader.
Impact
Issue
[aria-hidden="true"] elements contain focusable descendents
ARIA IDs are not unique
Navigation
These are opportunities to improve keyboard navigation in your application.
Impact
Issue
Heading elements are not in a sequentially-descending order
Names and labels
These are opportunities to improve the semantics of the controls in your application. This may enhance the experience for users of assistive technology, like a screen reader.
Impact
Issue
Image elements do not have [alt] attributes
Links do not have a discernible name
Best practices
These items highlight common accessibility best practices.
Impact
Issue
[user-scalable="no"] is used in the <meta name="viewport"> element or the [maximum-scale] attribute is less than 5.
appiontools.com best practices score
Trust and Safety
Impact
Issue
Does not use HTTPS
Ensure CSP is effective against XSS attacks
General
Impact
Issue
Detected JavaScript libraries
Browser errors were logged to the console
Page has valid source maps
appiontools.com SEO score
Content Best Practices
Format your HTML in a way that enables crawlers to better understand your app’s content.
Impact
Issue
Image elements do not have [alt] attributes
Mobile Friendly
Make sure your pages are mobile friendly so users don’t have to pinch or zoom in order to read the content pages. [Learn more](https://developers.google.com/search/mobile-sites/).
Impact
Issue
Document uses legible font sizes
Tap targets are not sized appropriately
EN
EN
UTF-8
Language claimed in HTML meta tag should match the language actually used on the web page. Otherwise Appiontools.com can be misinterpreted by Google and other search engines. Our service has detected that English is used on the page, and it matches the claimed language. Our system also found out that Appiontools.com main page’s claimed encoding is utf-8. Use of this encoding format is the best practice as the main page visitors from all over the world won’t have any issues with symbol transcription.
appiontools.com
Open Graph description is not detected on the main page of Appion Tools. Lack of Open Graph description can be counter-productive for their social media presence, as such a description allows converting a website homepage (or other pages) into good-looking, rich and well-structured posts, when it is being shared on Facebook and other social media. For example, adding the following code snippet into HTML <head> tag will help to represent this web page correctly in social networks: