Report Summary

  • 46

    Performance

    Renders faster than
    65% of other websites

  • 70

    Accessibility

    Visual factors better than
    that of 36% of websites

  • 58

    Best Practices

    More advanced features
    available than in
    19% of websites

  • 90

    SEO

    Google-friendlier than
    68% of websites

atoutdiagnostic.com

Boostez les signaux web essentiels de vos clients avec ATOUT DIAGNOSTIC.COM

Page Load Speed

5.1 sec in total

First Response

1.1 sec

Resources Loaded

3.7 sec

Page Rendered

340 ms
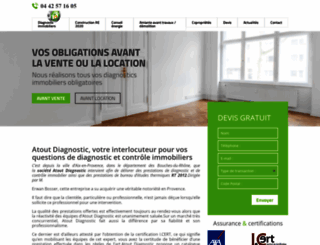
atoutdiagnostic.com screenshot

About Website

Visit atoutdiagnostic.com now to see the best up-to-date ATOUT DIAGNOSTIC content and also check out these interesting facts you probably never knew about atoutdiagnostic.com

Découvrez une infrastructure sérieuse, fiable et performante en terme de rapidité d'affichage, de signaux web essentiels, de sécurité contre les intrusions, de balisage enrichie, de protection co...

Visit atoutdiagnostic.com

Key Findings

We analyzed Atoutdiagnostic.com page load time and found that the first response time was 1.1 sec and then it took 4 sec to load all DOM resources and completely render a web page. This is a poor result, as 65% of websites can load faster.

Performance Metrics

atoutdiagnostic.com performance score

46

Measured Metrics

name

value

score

weighting

FCP (First Contentful Paint)

Value4.4 s

17/100

10%

LCP (Largest Contentful Paint)

Value6.4 s

10/100

25%

SI (Speed Index)

Value6.4 s

40/100

10%

TBT (Total Blocking Time)

Value480 ms

60/100

30%

CLS (Cumulative Layout Shift)

Value0

100/100

15%

TTI (Time to Interactive)

Value7.4 s

49/100

10%

Network Requests Diagram

atoutdiagnostic.com

1090 ms

www.atoutdiagnostic.com

980 ms

normalize.css

120 ms

style.css

173 ms

prettyPhoto.css

163 ms

Our browser made a total of 90 requests to load all elements on the main page. We found that 87% of them (78 requests) were addressed to the original Atoutdiagnostic.com, 4% (4 requests) were made to Google-analytics.com and 3% (3 requests) were made to Apis.google.com. The less responsive or slowest element that took the longest time to load (1.1 sec) belongs to the original domain Atoutdiagnostic.com.

Page Optimization Overview & Recommendations

Page size can be reduced by 671.5 kB (52%)

Content Size

1.3 MB

After Optimization

614.3 kB

In fact, the total size of Atoutdiagnostic.com main page is 1.3 MB. This result falls beyond the top 1M of websites and identifies a large and not optimized web page that may take ages to load. 55% of websites need less resources to load. Javascripts take 682.6 kB which makes up the majority of the site volume.

HTML Optimization

-79%

Potential reduce by 46.0 kB

  • Original 58.3 kB
  • After minification 55.1 kB
  • After compression 12.3 kB

HTML content can be minified and compressed by a website’s server. The most efficient way is to compress content using GZIP which reduces data amount travelling through the network between server and browser. HTML code on this page is well minified. It is highly recommended that content of this web page should be compressed using GZIP, as it can save up to 46.0 kB or 79% of the original size.

Image Optimization

-2%

Potential reduce by 6.1 kB

  • Original 358.7 kB
  • After minification 352.7 kB

Image size optimization can help to speed up a website loading time. The chart above shows the difference between the size before and after optimization. ATOUT DIAGNOSTIC images are well optimized though.

JavaScript Optimization

-71%

Potential reduce by 483.3 kB

  • Original 682.6 kB
  • After minification 602.0 kB
  • After compression 199.3 kB

It’s better to minify JavaScript in order to improve website performance. The diagram shows the current total size of all JavaScript files against the prospective JavaScript size after its minification and compression. It is highly recommended that all JavaScript files should be compressed and minified as it can save up to 483.3 kB or 71% of the original size.

CSS Optimization

-73%

Potential reduce by 136.1 kB

  • Original 186.2 kB
  • After minification 155.0 kB
  • After compression 50.1 kB

CSS files minification is very important to reduce a web page rendering time. The faster CSS files can load, the earlier a page can be rendered. Atoutdiagnostic.com needs all CSS files to be minified and compressed as it can save up to 136.1 kB or 73% of the original size.

Requests Breakdown

Number of requests can be reduced by 69 (78%)

Requests Now

88

After Optimization

19

The browser has sent 88 CSS, Javascripts, AJAX and image requests in order to completely render the main page of ATOUT DIAGNOSTIC. We recommend that multiple CSS and JavaScript files should be merged into one by each type, as it can help reduce assets requests from 46 to 1 for JavaScripts and from 16 to 1 for CSS and as a result speed up the page load time.

Accessibility Review

atoutdiagnostic.com accessibility score

70

Accessibility Issues

Contrast

These are opportunities to improve the legibility of your content.

Impact

Issue

High

Background and foreground colors do not have a sufficient contrast ratio.

Navigation

These are opportunities to improve keyboard navigation in your application.

Impact

Issue

High

Heading elements are not in a sequentially-descending order

Names and labels

These are opportunities to improve the semantics of the controls in your application. This may enhance the experience for users of assistive technology, like a screen reader.

Impact

Issue

High

Form elements do not have associated labels

High

Links do not have a discernible name

Tables and lists

These are opportunities to improve the experience of reading tabular or list data using assistive technology, like a screen reader.

Impact

Issue

High

List items (<li>) are not contained within <ul> or <ol> parent elements.

Best Practices

atoutdiagnostic.com best practices score

58

Areas of Improvement

Trust and Safety

Impact

Issue

High

Does not use HTTPS

High

Includes front-end JavaScript libraries with known security vulnerabilities

Low

Ensure CSP is effective against XSS attacks

User Experience

Impact

Issue

High

Serves images with low resolution

General

Impact

Issue

Low

Detected JavaScript libraries

High

Browser errors were logged to the console

High

Issues were logged in the Issues panel in Chrome Devtools

SEO Factors

atoutdiagnostic.com SEO score

90

Search Engine Optimization Advices

Crawling and Indexing

To appear in search results, crawlers need access to your app.

Impact

Issue

High

Links are not crawlable

Mobile Friendly

Make sure your pages are mobile friendly so users don’t have to pinch or zoom in order to read the content pages. [Learn more](https://developers.google.com/search/mobile-sites/).

Impact

Issue

High

Document uses legible font sizes

High

Tap targets are not sized appropriately

Language and Encoding

  • Language Detected

    FR

  • Language Claimed

    FR

  • Encoding

    UTF-8

Language claimed in HTML meta tag should match the language actually used on the web page. Otherwise Atoutdiagnostic.com can be misinterpreted by Google and other search engines. Our service has detected that French is used on the page, and it matches the claimed language. Our system also found out that Atoutdiagnostic.com main page’s claimed encoding is utf-8. Use of this encoding format is the best practice as the main page visitors from all over the world won’t have any issues with symbol transcription.

Social Sharing Optimization

Open Graph data is detected on the main page of ATOUT DIAGNOSTIC. This is the best way to make the web page social media friendly. Here is how it looks like on Facebook: