3.1 sec in total
73 ms
1.6 sec
1.4 sec
Welcome to baremetrics.io homepage info - get ready to check Baremetrics best content right away, or after learning these important things about baremetrics.io
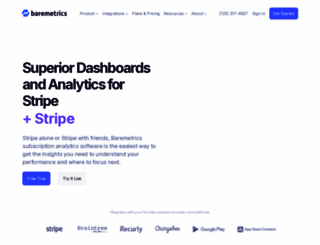
Baremetrics is Subscription Analytics and Insights: One click and you get hundreds of valuable metrics and business insights!
Visit baremetrics.ioWe analyzed Baremetrics.io page load time and found that the first response time was 73 ms and then it took 3 sec to load all DOM resources and completely render a web page. This is a poor result, as 55% of websites can load faster.
baremetrics.io performance score
name
value
score
weighting
Value3.4 s
38/100
10%
Value3.8 s
55/100
25%
Value8.0 s
22/100
10%
Value1,590 ms
12/100
30%
Value0.171
70/100
15%
Value21.5 s
1/100
10%
73 ms
183 ms
69 ms
68 ms
88 ms
Our browser made a total of 132 requests to load all elements on the main page. We found that 1% of them (1 request) were addressed to the original Baremetrics.io, 60% (79 requests) were made to Baremetrics.com and 23% (31 requests) were made to 24299515.fs1.hubspotusercontent-na1.net. The less responsive or slowest element that took the longest time to load (891 ms) relates to the external source Baremetrics.com.
Page size can be reduced by 170.5 kB (17%)
1.0 MB
862.1 kB
In fact, the total size of Baremetrics.io main page is 1.0 MB. This result falls beyond the top 1M of websites and identifies a large and not optimized web page that may take ages to load. 80% of websites need less resources to load and that’s why Accessify’s recommendations for optimization and resource minification can be helpful for this project. Images take 698.1 kB which makes up the majority of the site volume.
Potential reduce by 143.8 kB
HTML content can be minified and compressed by a website’s server. The most efficient way is to compress content using GZIP which reduces data amount travelling through the network between server and browser. This page needs HTML code to be minified as it can gain 44.4 kB, which is 27% of the original size. It is highly recommended that content of this web page should be compressed using GZIP, as it can save up to 143.8 kB or 89% of the original size.
Potential reduce by 255 B
Image size optimization can help to speed up a website loading time. The chart above shows the difference between the size before and after optimization. Baremetrics images are well optimized though.
Potential reduce by 7.3 kB
It’s better to minify JavaScript in order to improve website performance. The diagram shows the current total size of all JavaScript files against the prospective JavaScript size after its minification and compression. This website has mostly compressed JavaScripts.
Potential reduce by 19.1 kB
CSS files minification is very important to reduce a web page rendering time. The faster CSS files can load, the earlier a page can be rendered. Baremetrics.io needs all CSS files to be minified and compressed as it can save up to 19.1 kB or 29% of the original size.
Number of requests can be reduced by 66 (55%)
119
53
The browser has sent 119 CSS, Javascripts, AJAX and image requests in order to completely render the main page of Baremetrics. We recommend that multiple CSS and JavaScript files should be merged into one by each type, as it can help reduce assets requests from 19 to 1 for JavaScripts and from 17 to 1 for CSS and as a result speed up the page load time.
baremetrics.io
73 ms
baremetrics.com
183 ms
jquery.min.js
69 ms
main.css
68 ms
all.min.css
88 ms
theme-overrides.min.css
84 ms
css2
60 ms
css2
87 ms
child.min.css
157 ms
child-2.css
278 ms
child3.min.css
104 ms
LanguageSwitcher.css
111 ms
calendly.css
113 ms
module_125068936075_advanced-two-column-content.min.css
111 ms
glide.min.css
165 ms
module_125059379762_logo-slider.min.css
154 ms
module_125077417762_features.min.css
160 ms
module_125059379775_testimonials.min.css
160 ms
module_125576181158_our-publications.min.css
353 ms
module_125064636315_social-icons.min.css
219 ms
js
97 ms
jquery-1.7.1.js
201 ms
embed.js
86 ms
child.min.js
205 ms
aos.min.js
486 ms
project.js
246 ms
web-interactives-embed.js
80 ms
calendly.js
281 ms
glide.min.js
260 ms
parallax.min.js
282 ms
main.min.js
296 ms
isotop.min.js
332 ms
v2.js
451 ms
24299515.js
345 ms
index.js
450 ms
baremetrics-2024-arrow-grey.svg
305 ms
interactive-165354437923.png
503 ms
baremetrics-logo.svg
110 ms
logo-stripe.svg
293 ms
logo-braintree.svg
109 ms
logo-recurly.svg
113 ms
logo-chargebee.svg
111 ms
logo-google-play.svg
287 ms
logo-app-store-connect.svg
291 ms
logo-shopify-partners.svg
287 ms
image%20(20).png
290 ms
image%20(21).png
289 ms
Untitled%20design%20(1).png
603 ms
Paypal.png
713 ms
icon-control-center.svg
335 ms
thumbnail_control-center.png
420 ms
icon-smart-dashboards.svg
497 ms
thumbnail_dashboard.png
493 ms
icon-forecasting.svg
498 ms
thumbnail_forecast.png
493 ms
customers--todoist.svg
593 ms
customers--product-hunt.svg
592 ms
customers--bigcartel.svg
588 ms
customers--working-not-working.svg
594 ms
customers--hubstaff.svg
701 ms
customers--convertkit.svg
692 ms
customers--lookback.svg
601 ms
customers--npm.svg
694 ms
icon-benchmarks.svg
707 ms
thumbnail_benchmarks.png
696 ms
thumbnail_goals.png
706 ms
icon-trial-insights.svg
707 ms
thumbnail_trial-insights.png
709 ms
white-9.png
891 ms
interactive-165334279758.png
585 ms
icon-subscription-analytics.svg
494 ms
icon-recover.svg
332 ms
icon-cancellation-insights.svg
417 ms
icon-financial-forecasting.svg
490 ms
startup-accelerator-background.svg
491 ms
free-trial-background.svg
310 ms
icon-apple-pay.svg
482 ms
icon-google-play-store.svg
484 ms
icon-shopify.svg
487 ms
icon-stripe.svg
579 ms
icon-braintree.svg
586 ms
icon-chargebee.svg
592 ms
icon-reculry.svg
582 ms
icon-quickbooks.svg
579 ms
icon-xero.svg
580 ms
icon-universal-connector.svg
595 ms
unified-connection.gif
603 ms
icon-blog.svg
597 ms
icon-academy.svg
592 ms
icon-founders-chats.svg
600 ms
icon-developers.svg
686 ms
icon-help-center.svg
602 ms
icon-experts.svg
604 ms
icon-benchmark.svg
689 ms
icon-statups.svg
694 ms
icon-accelerator.svg
699 ms
icon-chartmogul.png
700 ms
icon-about.svg
697 ms
icon-customers.svg
692 ms
icon-wall-of-love.png
700 ms
user-matt-later.png
640 ms
icon-augmentation.svg
638 ms
regular.woff
661 ms
UcCO3FwrK3iLTeHuS_fvQtMwCp50KnMw2boKoduKmMEVuLyfMZg.ttf
259 ms
UcCO3FwrK3iLTeHuS_fvQtMwCp50KnMw2boKoduKmMEVuI6fMZg.ttf
422 ms
UcCO3FwrK3iLTeHuS_fvQtMwCp50KnMw2boKoduKmMEVuGKYMZg.ttf
503 ms
UcCO3FwrK3iLTeHuS_fvQtMwCp50KnMw2boKoduKmMEVuFuYMZg.ttf
504 ms
KFOmCnqEu92Fr1Me5Q.ttf
501 ms
KFOlCnqEu92Fr1MmEU9vAw.ttf
500 ms
KFOlCnqEu92Fr1MmSU5vAw.ttf
501 ms
KFOkCnqEu92Fr1MmgWxP.ttf
500 ms
KFOlCnqEu92Fr1MmWUlvAw.ttf
504 ms
regular.woff
718 ms
thumbnail_augmentation.png
604 ms
icon-segmentation.svg
630 ms
thumbnail_segmentation.png
628 ms
icon-people-insights.svg
629 ms
24299515.js
225 ms
banner.js
219 ms
thumbnail_customers.png
536 ms
user-ben-zoomshift.jpg
538 ms
homepage-features_cancellation-insights.png
532 ms
user-tushar-statusbrew.png
605 ms
homepage-features_recover.png
602 ms
innovators.png
593 ms
homepage-control-center.jpg
560 ms
stripe-verified.svg
478 ms
icon-dribbble-white.png
410 ms
icon-instagram-white.png
408 ms
icon-twitter-white.png
419 ms
icon-facebook-white.png
415 ms
tq0xuv22
45 ms
baremetrics.io accessibility score
Contrast
These are opportunities to improve the legibility of your content.
Impact
Issue
Background and foreground colors do not have a sufficient contrast ratio.
Navigation
These are opportunities to improve keyboard navigation in your application.
Impact
Issue
Heading elements are not in a sequentially-descending order
Names and labels
These are opportunities to improve the semantics of the controls in your application. This may enhance the experience for users of assistive technology, like a screen reader.
Impact
Issue
Links do not have a discernible name
baremetrics.io best practices score
Trust and Safety
Impact
Issue
Does not use HTTPS
Includes front-end JavaScript libraries with known security vulnerabilities
Ensure CSP is effective against XSS attacks
User Experience
Impact
Issue
Serves images with low resolution
General
Impact
Issue
Detected JavaScript libraries
Page has valid source maps
baremetrics.io SEO score
Content Best Practices
Format your HTML in a way that enables crawlers to better understand your app’s content.
Impact
Issue
Links do not have descriptive text
Mobile Friendly
Make sure your pages are mobile friendly so users don’t have to pinch or zoom in order to read the content pages. [Learn more](https://developers.google.com/search/mobile-sites/).
Impact
Issue
Document uses legible font sizes
EN
EN
UTF-8
Language claimed in HTML meta tag should match the language actually used on the web page. Otherwise Baremetrics.io can be misinterpreted by Google and other search engines. Our service has detected that English is used on the page, and it matches the claimed language. Our system also found out that Baremetrics.io main page’s claimed encoding is utf-8. Use of this encoding format is the best practice as the main page visitors from all over the world won’t have any issues with symbol transcription.
baremetrics.io
Open Graph data is detected on the main page of Baremetrics. This is the best way to make the web page social media friendly. Here is how it looks like on Facebook: